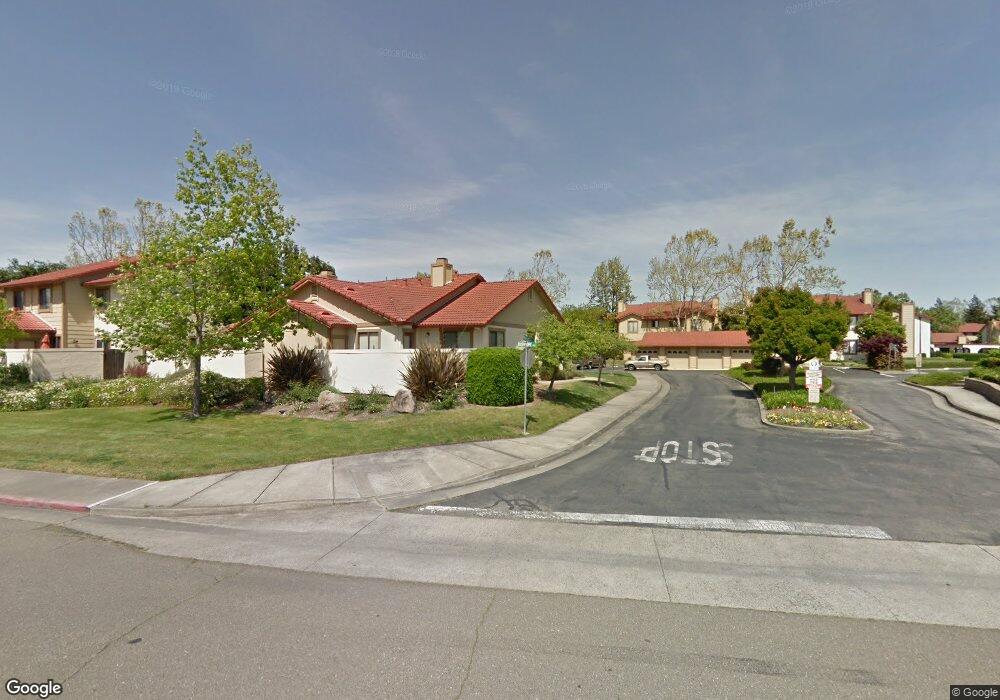
402 Park Place Dr Unit 1 Petaluma, CA 94954
College Heights NeighborhoodEstimated Value: $521,000 - $670,000
2
Beds
2
Baths
1,169
Sq Ft
$491/Sq Ft
Est. Value
About This Home
This home is located at 402 Park Place Dr Unit 1, Petaluma, CA 94954 and is currently estimated at $573,640, approximately $490 per square foot. 402 Park Place Dr Unit 1 is a home located in Sonoma County with nearby schools including Kenilworth Junior High School, Casa Grande High School, and Sonoma Mountain Elementary School.
Ownership History
Date
Name
Owned For
Owner Type
Purchase Details
Closed on
Jul 27, 2016
Sold by
Mungle Gary D and Mungle Linda D
Bought by
Miller April and Miller Kyle
Current Estimated Value
Home Financials for this Owner
Home Financials are based on the most recent Mortgage that was taken out on this home.
Original Mortgage
$380,000
Outstanding Balance
$303,782
Interest Rate
3.54%
Mortgage Type
New Conventional
Estimated Equity
$269,858
Purchase Details
Closed on
May 12, 2006
Sold by
Daw Karla Gay and Edsinger Richard Warren
Bought by
Mungle Gary D and Mungle Linda D
Home Financials for this Owner
Home Financials are based on the most recent Mortgage that was taken out on this home.
Original Mortgage
$380,000
Interest Rate
6.41%
Mortgage Type
Purchase Money Mortgage
Purchase Details
Closed on
Apr 26, 2002
Sold by
Edsinger Harriet C
Bought by
Edsinger Harriet C and The Harriet C Edsinger Revocab
Purchase Details
Closed on
May 25, 1995
Sold by
Young America Homes Inc
Bought by
Edsinger Harriett C
Create a Home Valuation Report for This Property
The Home Valuation Report is an in-depth analysis detailing your home's value as well as a comparison with similar homes in the area
Home Values in the Area
Average Home Value in this Area
Purchase History
| Date | Buyer | Sale Price | Title Company |
|---|---|---|---|
| Miller April | $415,000 | Fidelity National Title Co | |
| Mungle Gary D | $430,000 | Old Republic Title Company | |
| Edsinger Harriet C | -- | -- | |
| Edsinger Harriett C | $137,000 | North American Title Company |
Source: Public Records
Mortgage History
| Date | Status | Borrower | Loan Amount |
|---|---|---|---|
| Open | Miller April | $380,000 | |
| Previous Owner | Mungle Gary D | $380,000 |
Source: Public Records
Tax History Compared to Growth
Tax History
| Year | Tax Paid | Tax Assessment Tax Assessment Total Assessment is a certain percentage of the fair market value that is determined by local assessors to be the total taxable value of land and additions on the property. | Land | Improvement |
|---|---|---|---|---|
| 2025 | $5,214 | $481,637 | $192,654 | $288,983 |
| 2024 | $5,214 | $472,194 | $188,877 | $283,317 |
| 2023 | $5,214 | $462,936 | $185,174 | $277,762 |
| 2022 | $5,092 | $453,860 | $181,544 | $272,316 |
| 2021 | $5,032 | $444,962 | $177,985 | $266,977 |
| 2020 | $5,067 | $440,400 | $176,160 | $264,240 |
| 2019 | $5,014 | $431,765 | $172,706 | $259,059 |
| 2018 | $4,867 | $423,300 | $169,320 | $253,980 |
| 2017 | $4,795 | $415,000 | $166,000 | $249,000 |
| 2016 | $4,176 | $366,000 | $146,000 | $220,000 |
| 2015 | $3,756 | $333,000 | $133,000 | $200,000 |
| 2014 | $2,865 | $252,000 | $101,000 | $151,000 |
Source: Public Records
Map
Nearby Homes
- 20 Oakwood Dr
- 63 Oakwood Dr
- 104 Banff Way
- 1622 Flanigan Way
- 529 Rosewood Cir
- 71 Candlewood Dr
- 116 Marvin Ct
- 523 Greenwich St
- 628 Nikki Dr
- 717 N Mcdowell Blvd Unit 111
- 717 N Mcdowell Blvd Unit 201
- 717 N Mcdowell Blvd Unit 511
- 13 Arlington Dr
- 1441 Woodside Cir
- 1463 Woodside Cir
- 1407 Woodside Cir
- 65 Arlington Dr
- 55 Burlington Dr
- 1548 Royal Oak Dr
- 1501 Florence Way
- 404 Park Place Dr Unit 2
- 406 Park Place Dr Unit 3
- 408 Park Place Dr
- 162 Park Place Dr Unit 32
- 410 Park Place Dr
- 412 Park Place Dr Unit 6
- 160 Park Place Dr
- 201 Rushmore Ave
- 213 Rushmore Ave
- 100 Glacier Ct
- 482 Park Place Dr
- 486 Park Place Dr Unit 91
- 484 Park Place Dr
- 414 Park Place Dr Unit 7
- 488 Park Place Dr
- 217 Rushmore Ave
- 416 Park Place Dr
- 158 Park Place Dr
- 478 Park Place Dr Unit 88
- 480 Park Place Dr