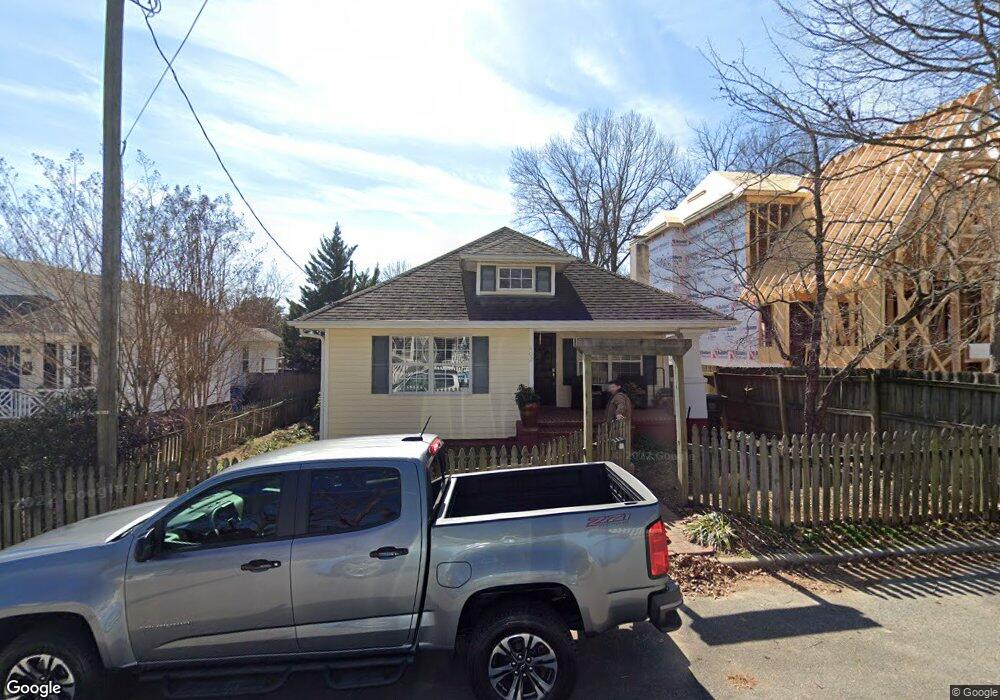
402 Pershing Rd Raleigh, NC 27608
Hi-mount NeighborhoodEstimated Value: $568,945 - $670,000
3
Beds
2
Baths
1,228
Sq Ft
$503/Sq Ft
Est. Value
About This Home
This home is located at 402 Pershing Rd, Raleigh, NC 27608 and is currently estimated at $617,986, approximately $503 per square foot. 402 Pershing Rd is a home located in Wake County with nearby schools including Underwood Magnet Elementary School, Oberlin Middle School, and Broughton Magnet High School.
Ownership History
Date
Name
Owned For
Owner Type
Purchase Details
Closed on
Jun 8, 2022
Sold by
Cory Howes Michael and Arndt Lindsay
Bought by
Crazy Red Dog Llc
Current Estimated Value
Purchase Details
Closed on
Feb 22, 2022
Sold by
Crazy Red Dog Llc
Bought by
Howes Michael Cory and Howes Lindsay Arndt
Purchase Details
Closed on
Jan 1, 2017
Sold by
Howes Michael Cory and Howes Lindsey Terrence
Bought by
Crazy Red Dog Llc
Purchase Details
Closed on
Sep 30, 2016
Sold by
Mendoza Nelson J
Bought by
Howes Michael Cory and Howes Lindsay Arndt
Home Financials for this Owner
Home Financials are based on the most recent Mortgage that was taken out on this home.
Original Mortgage
$213,207
Interest Rate
3.43%
Mortgage Type
New Conventional
Purchase Details
Closed on
Feb 19, 2008
Sold by
Mendoza Nelson J
Bought by
Beasley Scott D
Purchase Details
Closed on
May 30, 2003
Sold by
Lewis Bobby R and Lewis Cynthia B
Bought by
Mendoza Nelson J
Home Financials for this Owner
Home Financials are based on the most recent Mortgage that was taken out on this home.
Original Mortgage
$160,800
Interest Rate
7.5%
Mortgage Type
Purchase Money Mortgage
Purchase Details
Closed on
Jan 6, 1999
Sold by
Jeffreys Marie C
Bought by
Lewis Bobby R and Lewis Cynthia B
Home Financials for this Owner
Home Financials are based on the most recent Mortgage that was taken out on this home.
Original Mortgage
$129,000
Interest Rate
7.8%
Create a Home Valuation Report for This Property
The Home Valuation Report is an in-depth analysis detailing your home's value as well as a comparison with similar homes in the area
Home Values in the Area
Average Home Value in this Area
Purchase History
| Date | Buyer | Sale Price | Title Company |
|---|---|---|---|
| Crazy Red Dog Llc | -- | Strauss Attorneys Pllc | |
| Howes Michael Cory | -- | Strauss Attorneys Pllc | |
| Crazy Red Dog Llc | -- | None Available | |
| Howes Michael Cory | $284,500 | None Available | |
| Beasley Scott D | -- | None Available | |
| Mendoza Nelson J | -- | None Available | |
| Mendoza Nelson J | $161,000 | -- | |
| Lewis Bobby R | $70,000 | -- |
Source: Public Records
Mortgage History
| Date | Status | Borrower | Loan Amount |
|---|---|---|---|
| Previous Owner | Howes Michael Cory | $213,207 | |
| Previous Owner | Mendoza Nelson J | $160,800 | |
| Previous Owner | Lewis Bobby R | $129,000 |
Source: Public Records
Tax History Compared to Growth
Tax History
| Year | Tax Paid | Tax Assessment Tax Assessment Total Assessment is a certain percentage of the fair market value that is determined by local assessors to be the total taxable value of land and additions on the property. | Land | Improvement |
|---|---|---|---|---|
| 2025 | $4,589 | $523,874 | $450,000 | $73,874 |
| 2024 | $4,570 | $523,874 | $450,000 | $73,874 |
| 2023 | $3,545 | $323,410 | $274,500 | $48,910 |
| 2022 | $3,295 | $323,410 | $274,500 | $48,910 |
| 2021 | $3,167 | $323,410 | $274,500 | $48,910 |
| 2020 | $3,109 | $323,410 | $274,500 | $48,910 |
| 2019 | $2,986 | $255,941 | $175,500 | $80,441 |
| 2018 | $2,816 | $255,941 | $175,500 | $80,441 |
| 2017 | $2,683 | $255,941 | $175,500 | $80,441 |
| 2016 | $2,628 | $255,941 | $175,500 | $80,441 |
| 2015 | $2,778 | $266,372 | $140,400 | $125,972 |
| 2014 | $2,635 | $266,372 | $140,400 | $125,972 |
Source: Public Records
Map
Nearby Homes
- 202 Georgetown Rd
- 400 Bryan Pointe Dr Unit 104
- 1610 Draper View Loop Unit 101
- 1523 1/2 Sunrise Ave
- 1523 Sunrise Ave
- 1521 1/2 Sunrise Ave
- 1521 Havenmont Ct
- 1521 Sunrise Ave
- 1523 Havenmont Ct
- 1525 Havenmont Ct
- 1533 Urban Trace Ln
- 1527 Urban Trace Ln
- 1525 Urban Trace Ln
- 1523 Urban Trace Ln
- 308 E Whitaker Mill Rd
- 204 E Whitaker Mill Rd
- 626 E Whitaker Mill Rd
- 214 Hudson St
- 203 W West Roanoke Park Dr
- 540 Ledbetter Ct
- 404 Pershing Rd
- 400 Pershing Rd
- 406 Pershing Rd
- 408 Pershing Rd
- 0000 Carson St
- 1534 Carson St
- 403 Pershing Rd
- 330 Pershing Rd
- 405 Pershing Rd
- 1600 Carson St
- 1532 Carson St
- 328 Pershing Rd
- 102 Revival Way
- 1530 Carson St
- 1535 Carson St
- 1535 Carson St Unit See
- 1604 Carson St
- 1601 Carson St
- 326 Pershing Rd
- 1533 Carson St