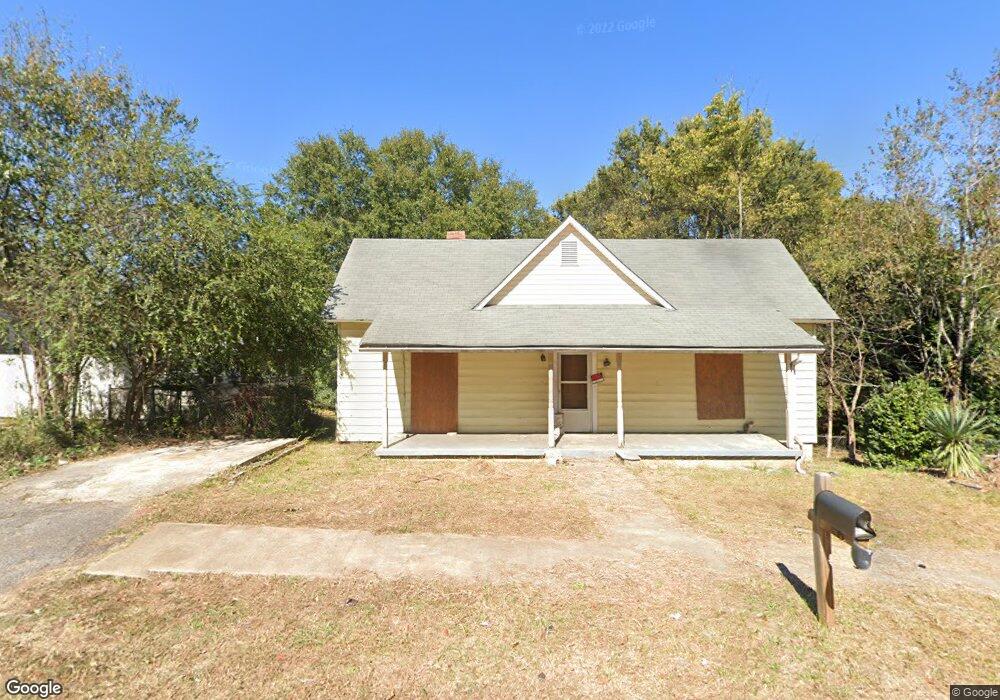
402 Rogers St Anderson, SC 29625
Estimated Value: $57,000 - $233,000
2
Beds
1
Bath
1,550
Sq Ft
$79/Sq Ft
Est. Value
About This Home
This home is located at 402 Rogers St, Anderson, SC 29625 and is currently estimated at $122,861, approximately $79 per square foot. 402 Rogers St is a home located in Anderson County with nearby schools including Centerville Elementary School, Anderson Institute of Technology, and Westside High School.
Ownership History
Date
Name
Owned For
Owner Type
Purchase Details
Closed on
Apr 19, 2018
Sold by
Edwards Johnny H
Bought by
Perez Gregorio Ramon and Lopez Mendoza Maria Alva
Current Estimated Value
Purchase Details
Closed on
Jan 27, 2017
Sold by
Reo Ventures Llc
Bought by
Edwards Johnny H
Purchase Details
Closed on
Aug 8, 2016
Sold by
Woods Cove Iv Llc
Bought by
Lakeside Reo Ventures Llc
Purchase Details
Closed on
Mar 15, 2013
Sold by
Dyar Wade Nixon
Bought by
Cross Angela Vanessa
Purchase Details
Closed on
Feb 6, 2007
Sold by
Cross Angela Vanessa
Bought by
Dyar Wade Dixon
Create a Home Valuation Report for This Property
The Home Valuation Report is an in-depth analysis detailing your home's value as well as a comparison with similar homes in the area
Home Values in the Area
Average Home Value in this Area
Purchase History
| Date | Buyer | Sale Price | Title Company |
|---|---|---|---|
| Perez Gregorio Ramon | $22,000 | None Available | |
| Edwards Johnny H | $10,000 | None Available | |
| Lakeside Reo Ventures Llc | -- | None Available | |
| Cross Angela Vanessa | -- | -- | |
| Dyar Wade Dixon | -- | None Available |
Source: Public Records
Tax History Compared to Growth
Tax History
| Year | Tax Paid | Tax Assessment Tax Assessment Total Assessment is a certain percentage of the fair market value that is determined by local assessors to be the total taxable value of land and additions on the property. | Land | Improvement |
|---|---|---|---|---|
| 2024 | $538 | $1,350 | $220 | $1,130 |
| 2023 | $538 | $1,350 | $220 | $1,130 |
| 2022 | $497 | $1,350 | $220 | $1,130 |
| 2021 | $488 | $1,270 | $210 | $1,060 |
| 2020 | $479 | $1,270 | $210 | $1,060 |
| 2019 | $445 | $1,270 | $210 | $1,060 |
| 2018 | $445 | $1,180 | $210 | $970 |
| 2017 | -- | $1,180 | $210 | $970 |
| 2016 | $509 | $1,630 | $270 | $1,360 |
| 2015 | $580 | $1,630 | $270 | $1,360 |
| 2014 | $567 | $1,630 | $270 | $1,360 |
Source: Public Records
Map
Nearby Homes