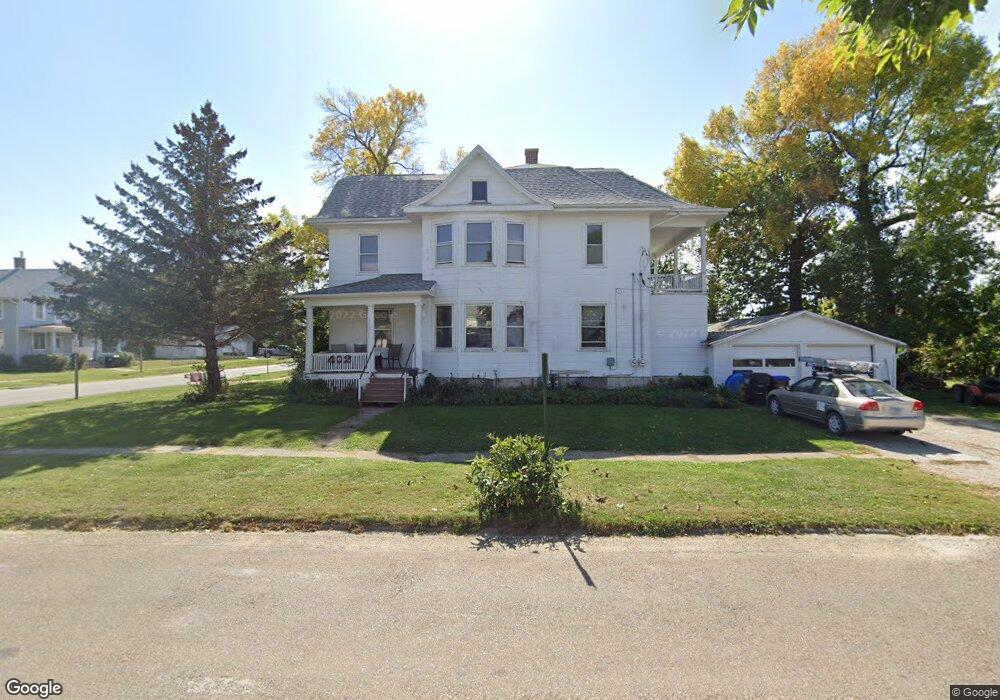
402 W 13th St Vinton, IA 52349
Estimated Value: $135,000 - $152,000
3
Beds
2
Baths
2,522
Sq Ft
$56/Sq Ft
Est. Value
About This Home
This home is located at 402 W 13th St, Vinton, IA 52349 and is currently estimated at $141,721, approximately $56 per square foot. 402 W 13th St is a home located in Benton County with nearby schools including Tilford Elementary School, Shellsburg Elementary School, and Vinton-Shellsburg Middle School.
Ownership History
Date
Name
Owned For
Owner Type
Purchase Details
Closed on
Feb 13, 2019
Sold by
Us Bank Na
Bought by
Klima Roberta L and Borkowicz Laura
Current Estimated Value
Purchase Details
Closed on
Feb 16, 2009
Sold by
Hodges Judith Anne and Hodges Robert W
Bought by
Gihring Jonathan R
Home Financials for this Owner
Home Financials are based on the most recent Mortgage that was taken out on this home.
Original Mortgage
$58,000
Interest Rate
5.14%
Mortgage Type
New Conventional
Create a Home Valuation Report for This Property
The Home Valuation Report is an in-depth analysis detailing your home's value as well as a comparison with similar homes in the area
Home Values in the Area
Average Home Value in this Area
Purchase History
| Date | Buyer | Sale Price | Title Company |
|---|---|---|---|
| Klima Roberta L | $41,251 | -- | |
| Gihring Jonathan R | $85,000 | None Available |
Source: Public Records
Mortgage History
| Date | Status | Borrower | Loan Amount |
|---|---|---|---|
| Previous Owner | Gihring Jonathan R | $58,000 |
Source: Public Records
Tax History Compared to Growth
Tax History
| Year | Tax Paid | Tax Assessment Tax Assessment Total Assessment is a certain percentage of the fair market value that is determined by local assessors to be the total taxable value of land and additions on the property. | Land | Improvement |
|---|---|---|---|---|
| 2025 | $1,854 | $105,300 | $19,500 | $85,800 |
| 2024 | $1,816 | $98,900 | $19,500 | $79,400 |
| 2023 | $1,730 | $98,900 | $19,500 | $79,400 |
| 2022 | $1,776 | $80,400 | $15,600 | $64,800 |
| 2021 | $1,776 | $80,400 | $15,600 | $64,800 |
| 2020 | $1,110 | $79,300 | $14,800 | $64,500 |
| 2019 | $3,209 | $51,300 | $14,800 | $36,500 |
| 2018 | $1,936 | $100,900 | $14,200 | $86,700 |
| 2017 | $1,856 | $99,600 | $14,200 | $85,400 |
| 2016 | $1,820 | $93,100 | $13,300 | $79,800 |
| 2015 | $1,820 | $93,100 | $13,300 | $79,800 |
| 2014 | $1,754 | $89,800 | $0 | $0 |
Source: Public Records
Map
Nearby Homes