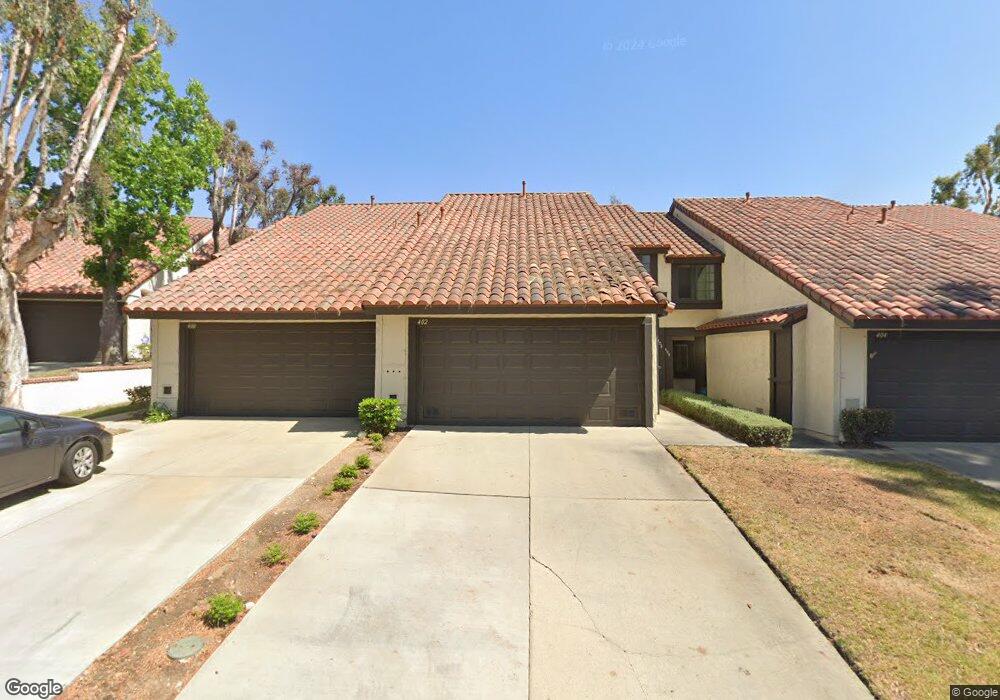
402 W Via Vaquero San Dimas, CA 91773
Estimated Value: $649,085 - $706,000
3
Beds
3
Baths
1,521
Sq Ft
$446/Sq Ft
Est. Value
About This Home
This home is located at 402 W Via Vaquero, San Dimas, CA 91773 and is currently estimated at $678,021, approximately $445 per square foot. 402 W Via Vaquero is a home located in Los Angeles County with nearby schools including Fred Ekstrand Elementary School, Lone Hill Middle School, and San Dimas High School.
Ownership History
Date
Name
Owned For
Owner Type
Purchase Details
Closed on
Apr 24, 2013
Sold by
Soursby Deborah K
Bought by
Soursby Deborah K
Current Estimated Value
Home Financials for this Owner
Home Financials are based on the most recent Mortgage that was taken out on this home.
Original Mortgage
$184,000
Outstanding Balance
$126,291
Interest Rate
2.87%
Mortgage Type
New Conventional
Estimated Equity
$551,730
Purchase Details
Closed on
Feb 8, 1995
Sold by
Soursby Randall
Bought by
Soursby Deborah K
Home Financials for this Owner
Home Financials are based on the most recent Mortgage that was taken out on this home.
Original Mortgage
$124,800
Interest Rate
9.21%
Purchase Details
Closed on
Jan 17, 1995
Sold by
Wong Henry P H and Wong Althea Y L
Bought by
Soursby Deborah K
Home Financials for this Owner
Home Financials are based on the most recent Mortgage that was taken out on this home.
Original Mortgage
$124,800
Interest Rate
9.21%
Create a Home Valuation Report for This Property
The Home Valuation Report is an in-depth analysis detailing your home's value as well as a comparison with similar homes in the area
Home Values in the Area
Average Home Value in this Area
Purchase History
| Date | Buyer | Sale Price | Title Company |
|---|---|---|---|
| Soursby Deborah K | -- | Title 365 | |
| Soursby Deborah K | -- | North American Title Company | |
| Soursby Deborah K | $156,000 | North American Title Company |
Source: Public Records
Mortgage History
| Date | Status | Borrower | Loan Amount |
|---|---|---|---|
| Open | Soursby Deborah K | $184,000 | |
| Closed | Soursby Deborah K | $124,800 |
Source: Public Records
Tax History Compared to Growth
Tax History
| Year | Tax Paid | Tax Assessment Tax Assessment Total Assessment is a certain percentage of the fair market value that is determined by local assessors to be the total taxable value of land and additions on the property. | Land | Improvement |
|---|---|---|---|---|
| 2025 | $3,318 | $261,995 | $83,122 | $178,873 |
| 2024 | $3,318 | $256,859 | $81,493 | $175,366 |
| 2023 | $3,242 | $251,824 | $79,896 | $171,928 |
| 2022 | $3,183 | $246,887 | $78,330 | $168,557 |
| 2021 | $3,112 | $242,047 | $76,795 | $165,252 |
| 2019 | $3,044 | $234,869 | $74,518 | $160,351 |
| 2018 | $2,904 | $230,264 | $73,057 | $157,207 |
| 2016 | $2,782 | $221,324 | $70,221 | $151,103 |
| 2015 | $2,738 | $218,001 | $69,167 | $148,834 |
| 2014 | $2,717 | $213,732 | $67,813 | $145,919 |
Source: Public Records
Map
Nearby Homes
- 404 W Via Vaquero
- 743 Smokewood Ln
- 730 Briarwood Ln
- 514 San Pablo Ct
- 0 E De Anza Heights Dr
- 765 Smokewood Ln
- 135 W Nubia St
- 770 S Tonopah Ct
- 402 E De Anza Heights Dr
- 751 Harwood Ct
- 748 S Walnut Ave
- 141 W 1st St
- 801 W Covina Blvd Unit 105
- 801 W Covina Blvd Unit 54
- 216 W 3rd St
- 518 Willow Place
- 208 E 3rd St
- 208 S Gaffney Ave
- 100 Rawlinsdale Ln
- 1213 Calle Vistaso
- 400 W Via Vaquero
- 406 W Via Vaquero
- 370 W Via Vaquero
- 408 W Via Vaquero
- 368 W Via Vaquero
- 410 W Via Vaquero
- 701 Santa Rosa Ct
- 366 W Via Vaquero
- 412 W Via Vaquero
- 702 Santa Rosa Ct
- 703 Santa Rosa Ct
- 704 Santa Rosa Ct
- 414 W Via Vaquero
- 364 W Via Vaquero
- 706 Santa Rosa Ct
- 705 Santa Rosa Ct
- 801 S San Carlos Ct
- 707 Santa Rosa Ct
- 808 S San Carlos Ct
- 708 Santa Rosa Ct