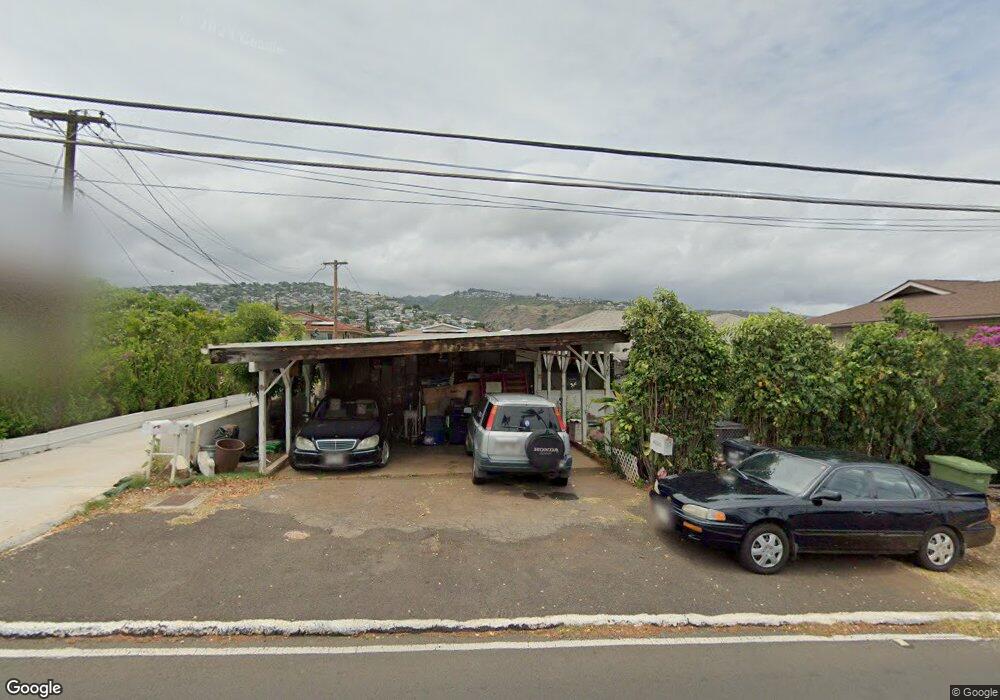
4020 Harding Ave Honolulu, HI 96816
Kaimuki NeighborhoodEstimated Value: $1,289,000 - $1,409,000
5
Beds
2
Baths
1,393
Sq Ft
$964/Sq Ft
Est. Value
About This Home
This home is located at 4020 Harding Ave, Honolulu, HI 96816 and is currently estimated at $1,342,192, approximately $963 per square foot. 4020 Harding Ave is a home located in Honolulu County with nearby schools including Kaimuki Middle School, Kalani High School, and Wai'alae Elementary Public Charter School.
Ownership History
Date
Name
Owned For
Owner Type
Purchase Details
Closed on
Feb 6, 2017
Sold by
Makalii Agnes Moy Sin
Bought by
Tam Hoy Harold Man Fong and Tam Hoy Arlene Cora
Current Estimated Value
Home Financials for this Owner
Home Financials are based on the most recent Mortgage that was taken out on this home.
Original Mortgage
$200,000
Outstanding Balance
$166,145
Interest Rate
4.32%
Mortgage Type
Credit Line Revolving
Estimated Equity
$1,176,047
Purchase Details
Closed on
May 20, 2013
Sold by
Tam Hoy Barry Man Cheong and Tam Hoy Bonnie Moo Lin
Bought by
Tam Hoy Harold Man Fong and Tam Hoy Arlene Cora
Home Financials for this Owner
Home Financials are based on the most recent Mortgage that was taken out on this home.
Original Mortgage
$331,000
Interest Rate
3.41%
Mortgage Type
New Conventional
Purchase Details
Closed on
Jan 14, 1997
Sold by
Tam Hoy Rose Lum and Tam Hoy Rose Y L
Bought by
Tam Hoy Rose Y L and Rose Y L Tam Hoy Revocable Living Trust
Create a Home Valuation Report for This Property
The Home Valuation Report is an in-depth analysis detailing your home's value as well as a comparison with similar homes in the area
Home Values in the Area
Average Home Value in this Area
Purchase History
| Date | Buyer | Sale Price | Title Company |
|---|---|---|---|
| Tam Hoy Harold Man Fong | $162,620 | Fam | |
| Tam Hoy Harold Man Fong | $162,620 | Fam | |
| Tam Hoy Harold Man Fong | $650,480 | Fntic | |
| Tam Hoy Harold Man Fong | $650,480 | Fntic | |
| Tam Hoy Rose Y L | -- | -- |
Source: Public Records
Mortgage History
| Date | Status | Borrower | Loan Amount |
|---|---|---|---|
| Open | Tam Hoy Harold Man Fong | $200,000 | |
| Closed | Tam Hoy Harold Man Fong | $200,000 | |
| Previous Owner | Tam Hoy Harold Man Fong | $331,000 |
Source: Public Records
Tax History Compared to Growth
Tax History
| Year | Tax Paid | Tax Assessment Tax Assessment Total Assessment is a certain percentage of the fair market value that is determined by local assessors to be the total taxable value of land and additions on the property. | Land | Improvement |
|---|---|---|---|---|
| 2025 | $3,822 | $1,371,100 | $1,068,400 | $302,700 |
| 2024 | $3,822 | $1,252,100 | $1,042,900 | $209,200 |
| 2023 | $3,211 | $1,157,500 | $1,042,900 | $114,600 |
| 2022 | $3,074 | $1,018,200 | $941,200 | $77,000 |
| 2021 | $3,149 | $1,039,700 | $864,900 | $174,800 |
| 2020 | $3,269 | $1,074,100 | $854,700 | $219,400 |
| 2019 | $2,944 | $961,100 | $834,400 | $126,700 |
| 2018 | $2,772 | $912,000 | $814,000 | $98,000 |
| 2017 | $2,862 | $937,700 | $773,300 | $164,400 |
| 2016 | $2,913 | $952,300 | $753,000 | $199,300 |
| 2015 | $2,905 | $950,000 | $697,000 | $253,000 |
| 2014 | $2,258 | $773,400 | $630,900 | $142,500 |
Source: Public Records
Map
Nearby Homes
- 4026 Harding Ave
- 1242 16th Ave
- 4340 Pahoa Ave Unit 19D
- 811 20th Ave
- 3741 Harding Ave
- 1222 15th Ave
- 1319 16th Ave
- 4229 Keanu St Unit 4
- 917 15th Ave
- 4570 Ahuli Place
- 4300 Waialae Ave Unit B601
- 4300 Waialae Ave Unit B1204
- 4300 Waialae Ave Unit A302
- 4303 Koae Place
- 1457 Hunakai St Unit 1
- 1457 Hunakai St Unit 4
- 4212 Keanu St Unit 1
- 4842 Kilauea Ave Unit 4
- 4206 Keanu St Unit 2
- 4206 Keanu St Unit 4
- 4020 Harding Ave Unit A
- 1108 20th Ave
- 4026 Harding Ave Unit Room 3
- 4012 Harding Ave
- 4012 Harding Ave Unit A
- 1114 20th Ave
- 1122 20th Ave
- 1122 20th Ave
- 1105 19th Ave
- 1111 19th Ave
- 14182 Hunakai St Unit 108
- 1117 19th Ave
- 1105 20th Ave
- 1107 20th Ave
- 1124A 20th Ave
- 1111 20th Ave
- 1128 20th Ave
- 1011 19th Ave
- 1127A 19th Ave
- 4042 Harding Ave Unit A