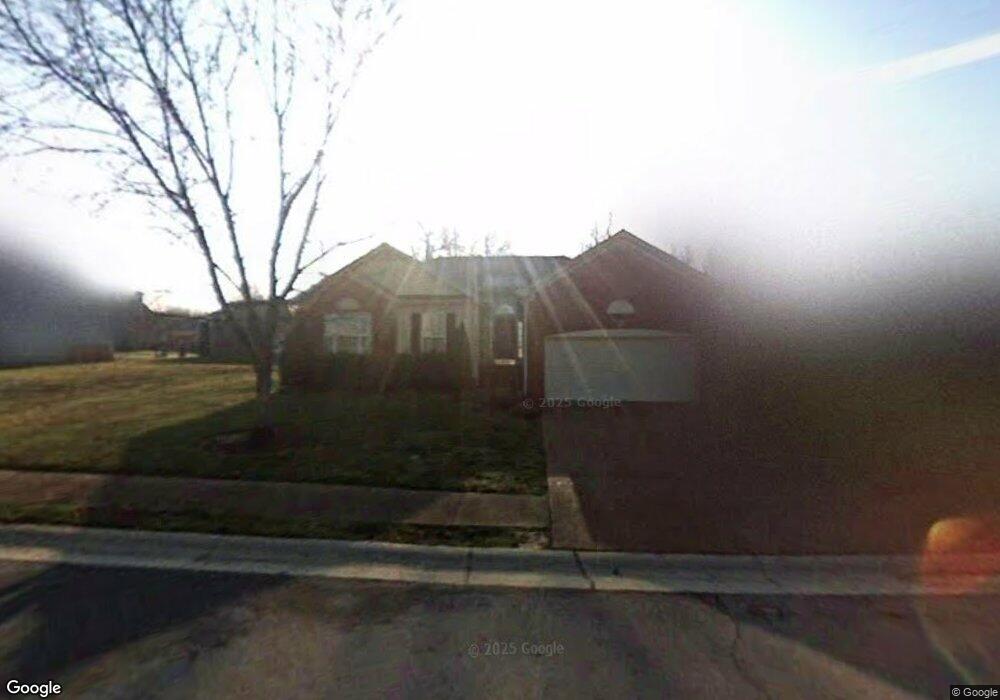
4021 Chase Point Place Joelton, TN 37080
Joelton NeighborhoodEstimated Value: $314,271 - $410,000
3
Beds
2
Baths
1,410
Sq Ft
$258/Sq Ft
Est. Value
About This Home
This home is located at 4021 Chase Point Place, Joelton, TN 37080 and is currently estimated at $363,318, approximately $257 per square foot. 4021 Chase Point Place is a home located in Davidson County with nearby schools including Joelton Elementary School, Joelton Middle School, and Haynes Middle.
Ownership History
Date
Name
Owned For
Owner Type
Purchase Details
Closed on
May 25, 2006
Sold by
Mast Brian A and Mast Lorri F
Bought by
Shonting Amy J
Current Estimated Value
Home Financials for this Owner
Home Financials are based on the most recent Mortgage that was taken out on this home.
Original Mortgage
$141,550
Outstanding Balance
$85,003
Interest Rate
7.25%
Mortgage Type
Unknown
Estimated Equity
$278,315
Purchase Details
Closed on
May 18, 2001
Sold by
Sheler Peggy Lee and Woods Peggy Lee Sheler
Bought by
Mast Brian A and Mast Lorri F
Home Financials for this Owner
Home Financials are based on the most recent Mortgage that was taken out on this home.
Original Mortgage
$135,429
Interest Rate
7.11%
Mortgage Type
FHA
Purchase Details
Closed on
Aug 28, 1998
Sold by
Fox Ridge Homes Inc
Bought by
Sheler Peggy Lee
Home Financials for this Owner
Home Financials are based on the most recent Mortgage that was taken out on this home.
Original Mortgage
$108,180
Interest Rate
6.96%
Mortgage Type
FHA
Create a Home Valuation Report for This Property
The Home Valuation Report is an in-depth analysis detailing your home's value as well as a comparison with similar homes in the area
Home Values in the Area
Average Home Value in this Area
Purchase History
| Date | Buyer | Sale Price | Title Company |
|---|---|---|---|
| Shonting Amy J | $149,000 | Grissim Title & Escrow Llc | |
| Mast Brian A | $136,500 | -- | |
| Sheler Peggy Lee | $120,600 | -- |
Source: Public Records
Mortgage History
| Date | Status | Borrower | Loan Amount |
|---|---|---|---|
| Open | Shonting Amy J | $141,550 | |
| Previous Owner | Mast Brian A | $135,429 | |
| Previous Owner | Sheler Peggy Lee | $108,180 |
Source: Public Records
Tax History Compared to Growth
Tax History
| Year | Tax Paid | Tax Assessment Tax Assessment Total Assessment is a certain percentage of the fair market value that is determined by local assessors to be the total taxable value of land and additions on the property. | Land | Improvement |
|---|---|---|---|---|
| 2025 | $1,961 | $70,500 | $18,750 | $51,750 |
| 2024 | $1,533 | $52,475 | $10,000 | $42,475 |
| 2023 | $1,533 | $52,475 | $10,000 | $42,475 |
| 2022 | $1,533 | $52,475 | $10,000 | $42,475 |
| 2021 | $1,550 | $52,475 | $10,000 | $42,475 |
| 2020 | $1,680 | $44,350 | $8,500 | $35,850 |
| 2019 | $1,222 | $44,350 | $8,500 | $35,850 |
| 2018 | $1,222 | $44,350 | $8,500 | $35,850 |
| 2017 | $977 | $44,350 | $8,500 | $35,850 |
| 2016 | $1,268 | $32,325 | $7,500 | $24,825 |
| 2015 | $1,268 | $32,325 | $7,500 | $24,825 |
| 2014 | $1,268 | $32,325 | $7,500 | $24,825 |
Source: Public Records
Map
Nearby Homes
- 0 Whites Creek Pike
- 7508 Gary Rd
- 1012 Gayron Dr
- 0 Twin Falls Dr
- 3828 Old Clarksville Pike
- 2812 Union Hill Rd
- 7181 Bidwell Rd
- 2860 Morgan Rd
- 5145 Creasy Dr
- 3755 Bear Hollow Rd
- 6343 Clarksville Pike
- 2480 Clay Lick Rd
- 5932 Clarksville Pike
- 6421 Clarksville Pike
- 0 Clarksville Pike Unit RTC2777773
- 0 Clarksville Pike Unit RTC2777775
- 4944 Whites Creek Pike
- 4222 Bernard Rd
- 0 Clay Lick Rd Unit RTC3047881
- 5843 Happy Hollow Ln
- 4025 Chase Point Place
- 4017 Chase Point Place
- 304 Jayme Mika Ct
- 4024 Chase Point Place
- 4024 Chase Point Place
- 4020 Chase Point Place
- 4028 Chase Point Place
- 4032 Chase Point Place
- 308 Jayme Mika Ct
- 4016 Chase Point Place
- 4013 Chase Point Place
- 312 Jayme Mika Ct
- 305 Jayme Mika Ct
- 309 Jayme Mika Ct
- 4012 Chase Point Place
- 4009 Chase Point Place
- 313 Jayme Mika Ct
- 405 Jordan Leigh Ct
- 316 Jayme Mika Ct
- 317 Jayme Mika Ct