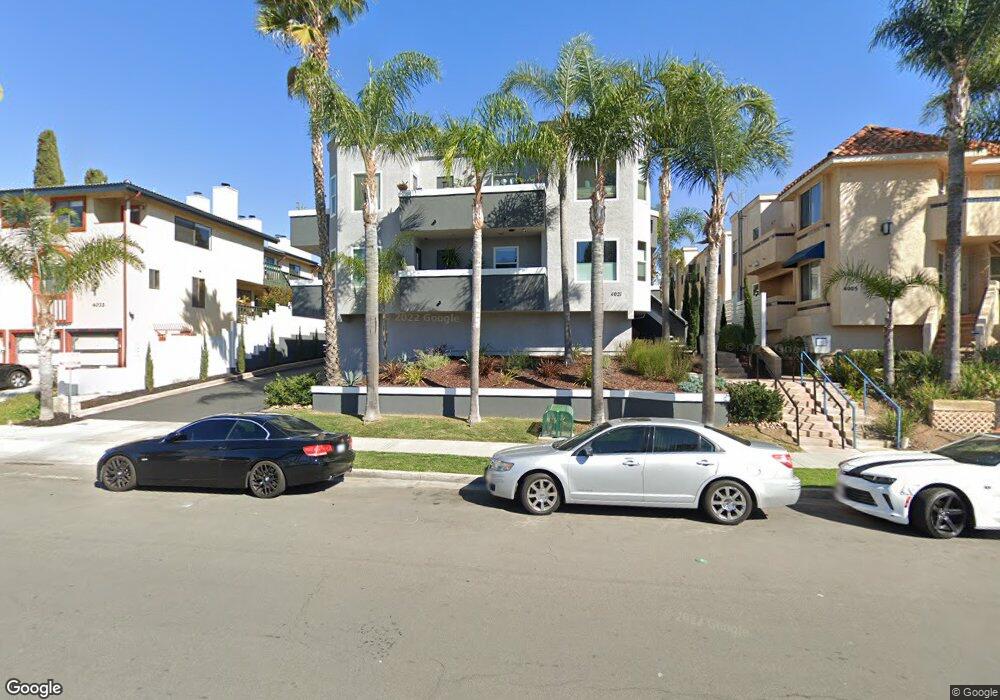
4021 Louisiana St Unit 1 San Diego, CA 92104
University Heights NeighborhoodEstimated Value: $693,048 - $751,000
2
Beds
2
Baths
1,016
Sq Ft
$708/Sq Ft
Est. Value
About This Home
This home is located at 4021 Louisiana St Unit 1, San Diego, CA 92104 and is currently estimated at $719,512, approximately $708 per square foot. 4021 Louisiana St Unit 1 is a home located in San Diego County with nearby schools including Birney Elementary School, Roosevelt International Middle School, and North Park Christian School.
Ownership History
Date
Name
Owned For
Owner Type
Purchase Details
Closed on
Jan 29, 2019
Sold by
Hudson Gregory S and Hudson Erin M
Bought by
Gray Ryan
Current Estimated Value
Home Financials for this Owner
Home Financials are based on the most recent Mortgage that was taken out on this home.
Original Mortgage
$480,000
Outstanding Balance
$421,145
Interest Rate
4.4%
Mortgage Type
VA
Estimated Equity
$298,367
Purchase Details
Closed on
Oct 17, 2018
Sold by
Hudson Erin M
Bought by
Hudson Gregory S and Hudson Erin M
Purchase Details
Closed on
Jun 18, 2012
Sold by
Danielson Jennean M
Bought by
Mckenna Erin R
Home Financials for this Owner
Home Financials are based on the most recent Mortgage that was taken out on this home.
Original Mortgage
$285,000
Interest Rate
3.63%
Mortgage Type
New Conventional
Purchase Details
Closed on
May 9, 2011
Sold by
North Island Financial Credit Union
Bought by
Danielson Jennean M
Home Financials for this Owner
Home Financials are based on the most recent Mortgage that was taken out on this home.
Original Mortgage
$255,358
Interest Rate
4.5%
Mortgage Type
FHA
Purchase Details
Closed on
Feb 23, 2011
Sold by
Galangue Ralph and Fronczkowski Barbara
Bought by
North Island Financial Credit Union
Purchase Details
Closed on
Mar 18, 2004
Sold by
Pool Kimberly A
Bought by
Galangue Ralph and Fronczkowski Barbara
Home Financials for this Owner
Home Financials are based on the most recent Mortgage that was taken out on this home.
Original Mortgage
$288,000
Interest Rate
5.25%
Mortgage Type
Purchase Money Mortgage
Purchase Details
Closed on
May 21, 2001
Sold by
Pool Kimberly A
Bought by
Pool Kimberly A
Home Financials for this Owner
Home Financials are based on the most recent Mortgage that was taken out on this home.
Original Mortgage
$150,000
Interest Rate
7.06%
Purchase Details
Closed on
Aug 10, 1999
Sold by
Lagina Glass
Bought by
Pool Kimberly A
Home Financials for this Owner
Home Financials are based on the most recent Mortgage that was taken out on this home.
Original Mortgage
$143,673
Interest Rate
7.47%
Mortgage Type
VA
Purchase Details
Closed on
Feb 20, 1998
Sold by
Steven Emerson
Bought by
Glass La Gina
Home Financials for this Owner
Home Financials are based on the most recent Mortgage that was taken out on this home.
Original Mortgage
$116,755
Interest Rate
7.05%
Mortgage Type
FHA
Create a Home Valuation Report for This Property
The Home Valuation Report is an in-depth analysis detailing your home's value as well as a comparison with similar homes in the area
Home Values in the Area
Average Home Value in this Area
Purchase History
| Date | Buyer | Sale Price | Title Company |
|---|---|---|---|
| Gray Ryan | $480,000 | California Title Company | |
| Hudson Gregory S | -- | None Available | |
| Mckenna Erin R | $300,000 | Lawyers Title | |
| Danielson Jennean M | $262,000 | Lawyers Title Sd | |
| North Island Financial Credit Union | $377,197 | Lawyers Title Sd | |
| Galangue Ralph | $360,000 | First American Title Co | |
| Pool Kimberly A | -- | Benefit Land Title Company | |
| Pool Kimberly A | $150,000 | Lawyers Title | |
| Pool Kimberly A | -- | Lawyers Title | |
| Glass La Gina | $123,000 | Lawyers Title |
Source: Public Records
Mortgage History
| Date | Status | Borrower | Loan Amount |
|---|---|---|---|
| Open | Gray Ryan | $480,000 | |
| Previous Owner | Mckenna Erin R | $285,000 | |
| Previous Owner | Danielson Jennean M | $255,358 | |
| Previous Owner | Galangue Ralph | $288,000 | |
| Previous Owner | Pool Kimberly A | $150,000 | |
| Previous Owner | Pool Kimberly A | $143,673 | |
| Previous Owner | Glass La Gina | $116,755 | |
| Closed | Galangue Ralph | $72,000 |
Source: Public Records
Tax History Compared to Growth
Tax History
| Year | Tax Paid | Tax Assessment Tax Assessment Total Assessment is a certain percentage of the fair market value that is determined by local assessors to be the total taxable value of land and additions on the property. | Land | Improvement |
|---|---|---|---|---|
| 2025 | $6,415 | $535,443 | $279,983 | $255,460 |
| 2024 | $6,415 | $524,945 | $274,494 | $250,451 |
| 2023 | $6,271 | $514,653 | $269,112 | $245,541 |
| 2022 | $6,102 | $504,563 | $263,836 | $240,727 |
| 2021 | $6,058 | $494,670 | $258,663 | $236,007 |
| 2020 | $5,984 | $489,599 | $256,011 | $233,588 |
| 2019 | $4,128 | $331,166 | $173,167 | $157,999 |
| 2018 | $3,861 | $324,673 | $169,772 | $154,901 |
| 2017 | $80 | $318,308 | $166,444 | $151,864 |
| 2016 | $3,709 | $312,068 | $163,181 | $148,887 |
| 2015 | $3,655 | $307,381 | $160,730 | $146,651 |
| 2014 | $3,598 | $301,361 | $157,582 | $143,779 |
Source: Public Records
Map
Nearby Homes
- 4005 Louisiana St Unit 1
- 4011-15 Mississippi St
- 4035 Mississippi St
- 3958 Louisiana St Unit 6
- 4020 Mississippi St Unit 2
- 2416 Polk Ave
- 4162 Arizona St
- 3805 Louisiana St
- 4185 Louisiana St Unit 7
- 3933-45 Hamilton St
- 4034 Florida St Unit 7
- 4127 Florida St Unit 1
- 3796 Alabama St Unit 118
- 3796 Alabama St Unit 304
- 3776 Alabama St Unit 116
- 3776 Alabama St Unit 117
- 3736-38 Louisiana St
- 3961 Georgia St
- 3776 Villa Terrace
- 3907 Georgia St Unit 12
- 4021 Louisiana St Unit 2
- 4025 Louisiana St Unit 4
- 4025 Louisiana St Unit 2
- 4025 Louisiana St Unit 3
- 4025 Louisiana St Unit 1
- 4021 Louisiana St Unit 4
- 4021 Louisiana St Unit 3
- 4011 Louisiana St Unit 4
- 4011 Louisiana St Unit 3
- 4011 Louisiana St Unit 2
- 4011 Louisiana St Unit 1
- 4033 Louisiana St Unit 5
- 4033 Louisiana St Unit 4
- 4033 Louisiana St Unit 3
- 4033 Louisiana St Unit 2
- 4033 Louisiana St Unit 1
- 4033 Louisiana St Unit 8
- 4033 Louisiana St Unit 6
- 4011 Louisiana St Unit#1
- 4015 Louisiana St Unit 4