Estimated Value: $2,206,592 - $2,818,000
2
Beds
3
Baths
1,860
Sq Ft
$1,290/Sq Ft
Est. Value
About This Home
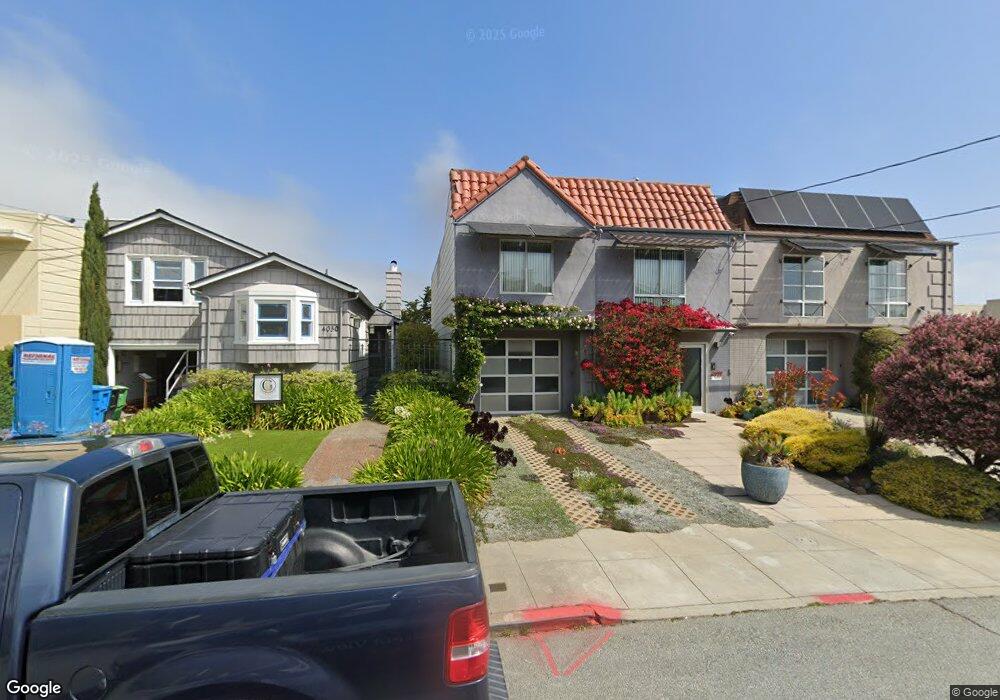
This home is located at 4022 21st St, San Francisco, CA 94114 and is currently estimated at $2,399,898, approximately $1,290 per square foot. 4022 21st St is a home located in San Francisco County with nearby schools including Harvey Milk Civil Rights Academy, Everett Middle School, and Thomas Edison Charter Academy.
Ownership History
Date
Name
Owned For
Owner Type
Purchase Details
Closed on
Jan 13, 2020
Sold by
Nash E Thomas E and Nash Madeleine
Bought by
Nash Edward Thomas and Nash Jessie Madeleine
Current Estimated Value
Purchase Details
Closed on
Feb 23, 2012
Sold by
Houpt Ellen Marguerite
Bought by
Nash E Thomas and Madeleine Nash J
Purchase Details
Closed on
Jul 14, 2010
Sold by
Williams Jane Looney
Bought by
Williams Jane Looney
Purchase Details
Closed on
Nov 2, 2005
Sold by
Williams Jane Looney
Bought by
Williams Jane Looney
Home Financials for this Owner
Home Financials are based on the most recent Mortgage that was taken out on this home.
Original Mortgage
$205,000
Interest Rate
5.9%
Mortgage Type
New Conventional
Create a Home Valuation Report for This Property
The Home Valuation Report is an in-depth analysis detailing your home's value as well as a comparison with similar homes in the area
Home Values in the Area
Average Home Value in this Area
Purchase History
| Date | Buyer | Sale Price | Title Company |
|---|---|---|---|
| Nash Edward Thomas | -- | None Available | |
| Nash E Thomas | $1,225,000 | Chicago Title Company | |
| Williams Jane Looney | -- | None Available | |
| Williams Jane Looney | -- | Alliance Title |
Source: Public Records
Mortgage History
| Date | Status | Borrower | Loan Amount |
|---|---|---|---|
| Previous Owner | Williams Jane Looney | $205,000 |
Source: Public Records
Tax History Compared to Growth
Tax History
| Year | Tax Paid | Tax Assessment Tax Assessment Total Assessment is a certain percentage of the fair market value that is determined by local assessors to be the total taxable value of land and additions on the property. | Land | Improvement |
|---|---|---|---|---|
| 2025 | $19,533 | $1,639,168 | $1,077,059 | $562,109 |
| 2024 | $19,533 | $1,607,030 | $1,055,941 | $551,089 |
| 2023 | $19,238 | $1,575,521 | $1,035,237 | $540,284 |
| 2022 | $18,873 | $1,544,630 | $1,014,939 | $529,691 |
| 2021 | $18,538 | $1,514,345 | $995,039 | $519,306 |
| 2020 | $18,753 | $1,498,819 | $984,837 | $513,982 |
| 2019 | $18,061 | $1,469,432 | $965,527 | $503,905 |
| 2018 | $17,453 | $1,440,622 | $946,596 | $494,026 |
| 2017 | $16,949 | $1,412,376 | $928,036 | $484,340 |
| 2016 | $15,679 | $1,299,771 | $909,840 | $389,931 |
| 2015 | $15,485 | $1,280,248 | $896,174 | $384,074 |
| 2014 | $15,078 | $1,255,171 | $878,620 | $376,551 |
Source: Public Records
Map
Nearby Homes
- 417-419 Eureka St
- 335 Diamond St
- 4229 21st St
- 308 Diamond St
- 306 Diamond St
- 584 Douglass St
- 734 Elizabeth St
- 317 Douglass St Unit 317
- 1 Hoffman Ave Unit A
- 4106 20th St
- 49 Seward St Unit 1
- 3711 Market St Unit 2
- 729 Douglass St
- 729 Douglass St Unit A
- 149 Eureka St
- 150 Eureka St Unit B
- 150 Eureka St Unit A
- 767 Corbett Ave Unit 3
- 755 Corbett Ave
- 938 Sanchez St
- 4014 21st St
- 4030 21st St
- 4036 21st St
- 4006 21st St
- 4006 21st St
- 4010 21st St
- 4042 21st St
- 4000 21st St
- 378 Collingwood St
- 375 Diamond St
- 4048 21st St
- 371 Diamond St
- 4052 21st St
- 364 Collingwood St Unit 368
- 367 Diamond St
- 358 Collingwood St Unit 358
- 356 Collingwood St
- 356 Collingwood St Unit 362
- 356 Collingwood St Unit 362
- 360 Collingwood St Unit 360