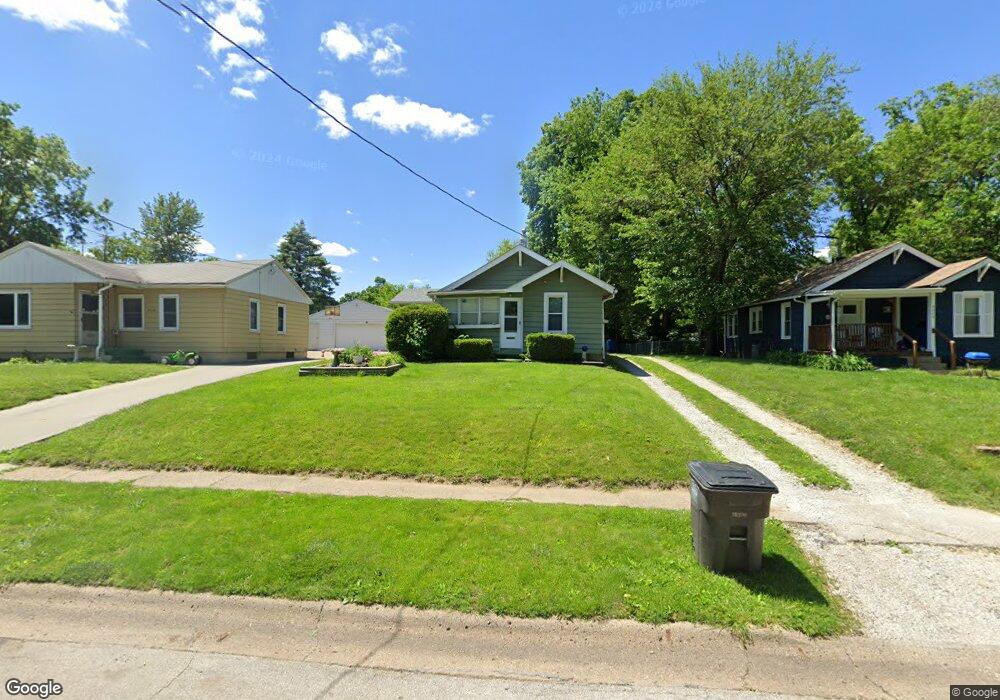
4022 7th St Des Moines, IA 50313
Oak Park NeighborhoodEstimated Value: $142,000 - $161,000
3
Beds
1
Bath
868
Sq Ft
$178/Sq Ft
Est. Value
About This Home
This home is located at 4022 7th St, Des Moines, IA 50313 and is currently estimated at $154,364, approximately $177 per square foot. 4022 7th St is a home located in Polk County with nearby schools including Oak Park Elementary School, Harding Middle School, and North High School.
Ownership History
Date
Name
Owned For
Owner Type
Purchase Details
Closed on
Aug 11, 1999
Sold by
Morris Marcella R and Morris Robert M
Bought by
Oliver Brian Lee and Oliver Kathryn Jolene
Current Estimated Value
Home Financials for this Owner
Home Financials are based on the most recent Mortgage that was taken out on this home.
Original Mortgage
$61,661
Interest Rate
7.7%
Create a Home Valuation Report for This Property
The Home Valuation Report is an in-depth analysis detailing your home's value as well as a comparison with similar homes in the area
Home Values in the Area
Average Home Value in this Area
Purchase History
| Date | Buyer | Sale Price | Title Company |
|---|---|---|---|
| Oliver Brian Lee | $19,500 | -- |
Source: Public Records
Mortgage History
| Date | Status | Borrower | Loan Amount |
|---|---|---|---|
| Closed | Oliver Brian Lee | $61,661 |
Source: Public Records
Tax History
| Year | Tax Paid | Tax Assessment Tax Assessment Total Assessment is a certain percentage of the fair market value that is determined by local assessors to be the total taxable value of land and additions on the property. | Land | Improvement |
|---|---|---|---|---|
| 2025 | $2,408 | $153,800 | $32,500 | $121,300 |
| 2024 | $2,408 | $132,900 | $28,000 | $104,900 |
| 2023 | $2,576 | $132,900 | $28,000 | $104,900 |
| 2022 | $2,248 | $118,200 | $26,300 | $91,900 |
| 2021 | $2,150 | $118,200 | $26,300 | $91,900 |
| 2020 | $2,230 | $107,900 | $24,100 | $83,800 |
| 2019 | $1,950 | $107,900 | $24,100 | $83,800 |
| 2018 | $1,926 | $94,200 | $20,700 | $73,500 |
| 2017 | $1,646 | $94,200 | $20,700 | $73,500 |
| 2016 | $1,598 | $82,500 | $18,000 | $64,500 |
| 2015 | $1,598 | $82,500 | $18,000 | $64,500 |
| 2014 | $1,424 | $80,000 | $17,200 | $62,800 |
Source: Public Records
Map
Nearby Homes
Your Personal Tour Guide
Ask me questions while you tour the home.