4022 Beaufain St Raleigh, NC 27604
Northeast Raleigh NeighborhoodEstimated Value: $274,000 - $298,000
--
Bed
3
Baths
1,502
Sq Ft
$189/Sq Ft
Est. Value
About This Home
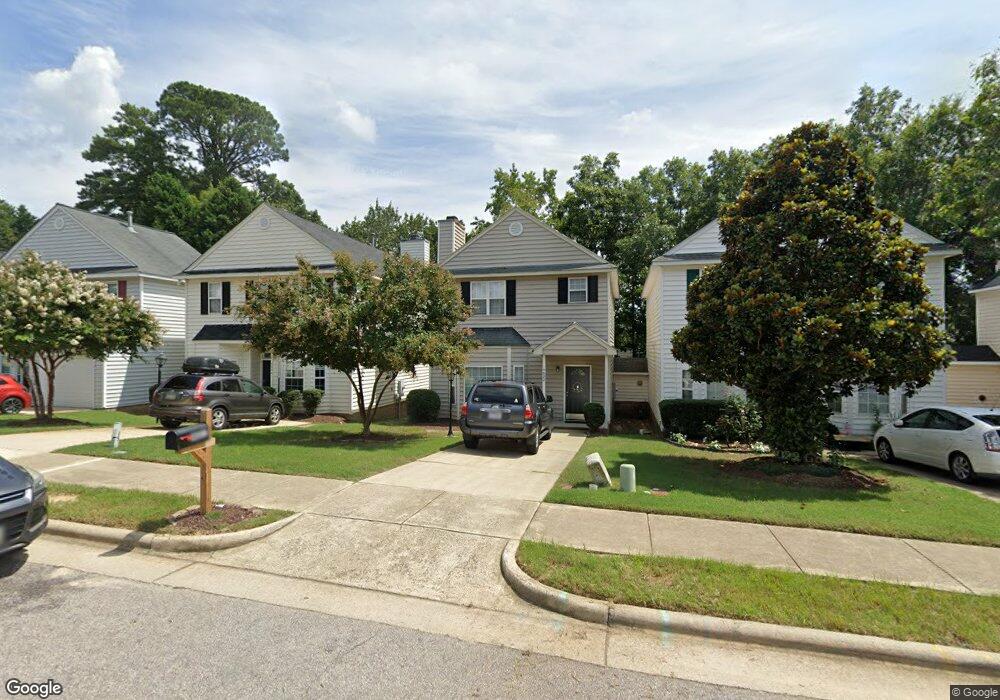
This home is located at 4022 Beaufain St, Raleigh, NC 27604 and is currently estimated at $283,180, approximately $188 per square foot. 4022 Beaufain St is a home located in Wake County with nearby schools including River Bend Elementary, River Bend Middle, and Rolesville High School.
Ownership History
Date
Name
Owned For
Owner Type
Purchase Details
Closed on
Dec 17, 2020
Sold by
Triangle Investment Fund Llc
Bought by
Baf 2 Llc
Current Estimated Value
Purchase Details
Closed on
Dec 18, 2014
Sold by
Zulu Investments Property Llc
Bought by
Triangle Investment Fund Llc
Purchase Details
Closed on
Dec 17, 2014
Sold by
Mikhail Melad and Mikhail Sally A
Bought by
Zulu Investment Property Llc
Purchase Details
Closed on
May 19, 2009
Sold by
Darboe Kinteh and Darboe Isatou
Bought by
Mikhail Melad and Mikhail Sally A
Home Financials for this Owner
Home Financials are based on the most recent Mortgage that was taken out on this home.
Original Mortgage
$88,522
Interest Rate
4.89%
Mortgage Type
FHA
Purchase Details
Closed on
Oct 29, 1997
Sold by
Sale Lynnette T
Bought by
Darboe Kinteh and Darboe Isatou
Home Financials for this Owner
Home Financials are based on the most recent Mortgage that was taken out on this home.
Original Mortgage
$107,163
Interest Rate
7.39%
Mortgage Type
FHA
Create a Home Valuation Report for This Property
The Home Valuation Report is an in-depth analysis detailing your home's value as well as a comparison with similar homes in the area
Home Values in the Area
Average Home Value in this Area
Purchase History
| Date | Buyer | Sale Price | Title Company |
|---|---|---|---|
| Baf 2 Llc | $3,945,000 | None Available | |
| Triangle Investment Fund Llc | -- | None Available | |
| Zulu Investment Property Llc | $88,000 | None Available | |
| Mikhail Melad | $110,000 | Fidelity National Title Insu | |
| Darboe Kinteh | $110,000 | -- |
Source: Public Records
Mortgage History
| Date | Status | Borrower | Loan Amount |
|---|---|---|---|
| Previous Owner | Mikhail Melad | $88,522 | |
| Previous Owner | Darboe Kinteh | $107,163 |
Source: Public Records
Tax History Compared to Growth
Tax History
| Year | Tax Paid | Tax Assessment Tax Assessment Total Assessment is a certain percentage of the fair market value that is determined by local assessors to be the total taxable value of land and additions on the property. | Land | Improvement |
|---|---|---|---|---|
| 2025 | $2,360 | $268,348 | $75,000 | $193,348 |
| 2024 | $2,351 | $268,348 | $75,000 | $193,348 |
| 2023 | $1,862 | $169,014 | $32,000 | $137,014 |
| 2022 | $1,731 | $169,014 | $32,000 | $137,014 |
| 2021 | $1,665 | $169,014 | $32,000 | $137,014 |
| 2020 | $1,634 | $169,014 | $32,000 | $137,014 |
| 2019 | $1,363 | $115,858 | $22,000 | $93,858 |
| 2018 | $1,286 | $115,858 | $22,000 | $93,858 |
| 2017 | $1,225 | $115,858 | $22,000 | $93,858 |
| 2016 | $1,200 | $115,858 | $22,000 | $93,858 |
| 2015 | $1,361 | $129,505 | $24,000 | $105,505 |
| 2014 | $1,291 | $129,505 | $24,000 | $105,505 |
Source: Public Records
Map
Nearby Homes
- 4612 Thorn Leaf Ct
- 4612 Hanging Fern Ln
- 4620 Mill Rock Ln
- 4712 Fox Fern Ln
- 3622 Top of the Pines Ct
- 3614 Top of the Pines Ct
- 4109 Stonewall Dr
- 4443 Antique Ln Unit D1
- 3936 Iron Horse Rd
- 4500 Rivershyre Way
- 4809 Arbor Chase Dr
- 4416 Major Loring Way
- 4604 Treadstone Ct
- 4522 Centrebrook Cir
- 3605 Windemere Place
- 4236 Saubranch Hill St
- 4508 Centrebrook Cir
- 4139 Davis Meadow St
- 4721 Mocha Ln
- 4809 Kaycee Ct
- 4020 Beaufain St
- 4024 Beaufain St
- 4026 Beaufain St
- 4016 Beaufain St
- 4100 Beaufain St
- 4014 Beaufain St
- 4637 Vendue Range Dr
- 4639 Vendue Range Dr
- 4635 Vendue Range Dr
- 4641 Vendue Range Dr
- 4021 Beaufain St
- 4023 Beaufain St
- 4019 Beaufain St
- 4102 Beaufain St
- 4012 Beaufain St
- 4633 Vendue Range Dr
- 4017 Beaufain St
- 4643 Vendue Range Dr
- 4631 Vendue Range Dr
- 4104 Beaufain St