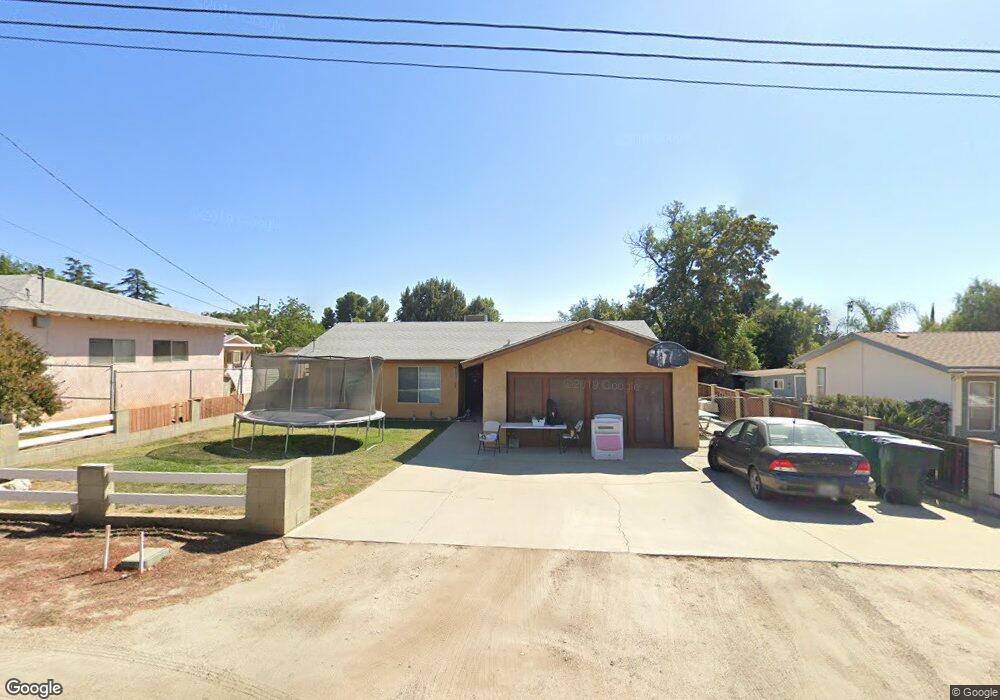
40223 O Neal Ave Beaumont, CA 92223
Estimated Value: $409,668 - $530,000
3
Beds
2
Baths
1,301
Sq Ft
$359/Sq Ft
Est. Value
About This Home
This home is located at 40223 O Neal Ave, Beaumont, CA 92223 and is currently estimated at $467,417, approximately $359 per square foot. 40223 O Neal Ave is a home located in Riverside County with nearby schools including Starlight Elementary School, San Gorgonio Middle School, and Beaumont Senior High School.
Ownership History
Date
Name
Owned For
Owner Type
Purchase Details
Closed on
Aug 13, 1999
Sold by
Field Mark M
Bought by
Field Albert A and Field Lynda Diane
Current Estimated Value
Home Financials for this Owner
Home Financials are based on the most recent Mortgage that was taken out on this home.
Original Mortgage
$86,367
Outstanding Balance
$24,644
Interest Rate
7.56%
Mortgage Type
FHA
Estimated Equity
$442,773
Purchase Details
Closed on
Apr 20, 1994
Sold by
Emc Mtg Corp
Bought by
Field Mark Mclain
Home Financials for this Owner
Home Financials are based on the most recent Mortgage that was taken out on this home.
Original Mortgage
$68,000
Interest Rate
7.79%
Mortgage Type
Purchase Money Mortgage
Purchase Details
Closed on
Dec 1, 1993
Sold by
Great Western Bank Fsb
Bought by
Emc Mtg Corp
Create a Home Valuation Report for This Property
The Home Valuation Report is an in-depth analysis detailing your home's value as well as a comparison with similar homes in the area
Home Values in the Area
Average Home Value in this Area
Purchase History
| Date | Buyer | Sale Price | Title Company |
|---|---|---|---|
| Field Albert A | $86,500 | Gateway Title Company | |
| Field Mark Mclain | $85,000 | Fidelity National Title | |
| Emc Mtg Corp | $64,500 | Fidelity National Title Ins |
Source: Public Records
Mortgage History
| Date | Status | Borrower | Loan Amount |
|---|---|---|---|
| Open | Field Albert A | $86,367 | |
| Previous Owner | Field Mark Mclain | $68,000 |
Source: Public Records
Tax History Compared to Growth
Tax History
| Year | Tax Paid | Tax Assessment Tax Assessment Total Assessment is a certain percentage of the fair market value that is determined by local assessors to be the total taxable value of land and additions on the property. | Land | Improvement |
|---|---|---|---|---|
| 2025 | $1,664 | $132,918 | $30,725 | $102,193 |
| 2023 | $1,664 | $127,759 | $29,533 | $98,226 |
| 2022 | $1,635 | $125,254 | $28,954 | $96,300 |
| 2021 | $1,603 | $122,799 | $28,387 | $94,412 |
| 2020 | $1,584 | $121,540 | $28,096 | $93,444 |
| 2019 | $1,558 | $119,158 | $27,546 | $91,612 |
| 2018 | $1,549 | $116,822 | $27,006 | $89,816 |
| 2017 | $1,522 | $114,532 | $26,477 | $88,055 |
| 2016 | $1,481 | $112,287 | $25,958 | $86,329 |
| 2015 | $1,455 | $110,602 | $25,569 | $85,033 |
| 2014 | $1,550 | $108,437 | $25,069 | $83,368 |
Source: Public Records
Map
Nearby Homes
- 10543 Winesap Ave
- 10596 El Monte Dr
- 40587 High St
- 0 Cherry Valley Blvd Unit OC25041579
- 10907 Winesap Ave
- 40451 Rome Beauty Way
- 10956 Cherry Ave
- 1322 Melstone St
- 10420 Bel Air Dr
- 40587 Dutton St
- 1475 Ellerg Way
- 10311 Bel Air Dr
- 10435 Frontier Trail
- 10497 Bel Air Dr
- 10475 Frontier Trail
- 10751 Deerfield Dr
- 40833 Caballero Dr
- 10165 Frontier Trail
- 40581 Norman Rd
- 1491 Alpine Ave
- 10591 Jonathan Ave
- 10587 Jonathan Ave
- 40226 Grand Ave
- 40246 Grand Ave
- 40210 Grand Ave
- 10590 Jonathan Ave
- 10610 Jonathan Ave
- 40196 Grand Ave
- 40254 Grand Ave
- 40179 O Neal Ave
- 40180 Grand Ave
- 40286 Grand Ave
- 40166 Grand Ave
- 40215 Grand Ave
- 10640 Jonathan Ave
- 40152 Grand Ave
- 40300 Grand Ave
- 40275 Grand Ave
- 40185 Grand Ave
- 10580 Jonathan Ave