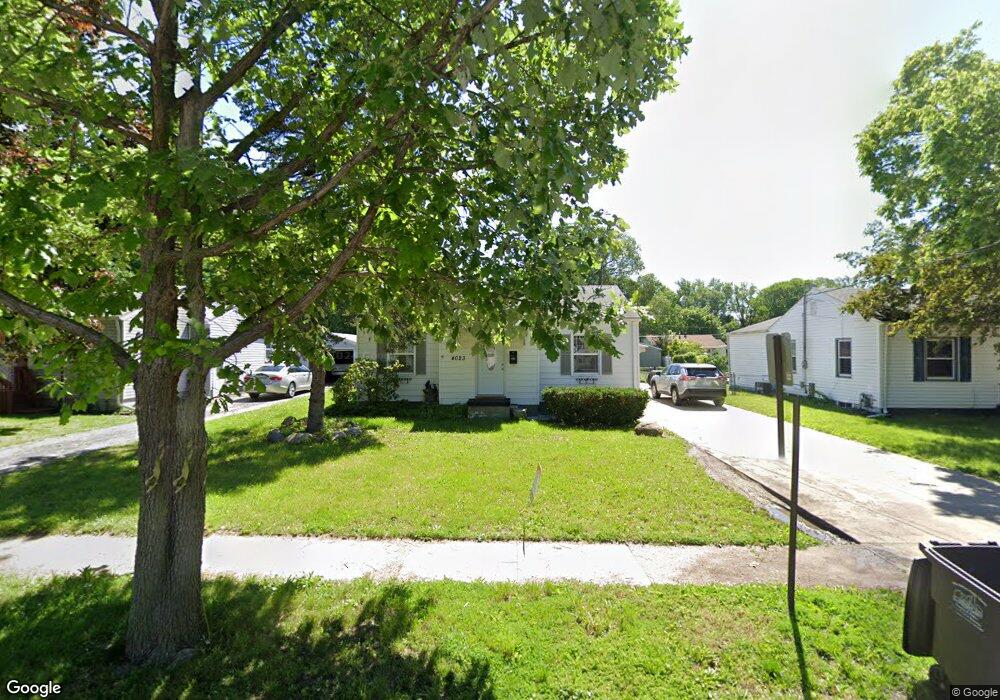
4023 15th St Des Moines, IA 50313
Oak Park NeighborhoodEstimated Value: $162,403 - $181,000
2
Beds
2
Baths
801
Sq Ft
$215/Sq Ft
Est. Value
About This Home
This home is located at 4023 15th St, Des Moines, IA 50313 and is currently estimated at $172,351, approximately $215 per square foot. 4023 15th St is a home located in Polk County with nearby schools including Oak Park Elementary School, Harding Middle School, and North High School.
Ownership History
Date
Name
Owned For
Owner Type
Purchase Details
Closed on
Nov 26, 2024
Sold by
Martindale Susan D and Martindale John Susan
Bought by
Martindale Jack A
Current Estimated Value
Purchase Details
Closed on
Feb 22, 2021
Sold by
Martindale Jack A and Martindale Susan D
Bought by
Martindale Jack A
Purchase Details
Closed on
Apr 3, 2012
Sold by
Howe Tyler E and Howe Tera
Bought by
Martindale Jack A and Martindale Susan D
Home Financials for this Owner
Home Financials are based on the most recent Mortgage that was taken out on this home.
Original Mortgage
$84,112
Interest Rate
3.95%
Mortgage Type
FHA
Purchase Details
Closed on
Feb 28, 2003
Sold by
Marker Martha E
Bought by
Howe Tyler
Home Financials for this Owner
Home Financials are based on the most recent Mortgage that was taken out on this home.
Original Mortgage
$75,050
Interest Rate
6.07%
Create a Home Valuation Report for This Property
The Home Valuation Report is an in-depth analysis detailing your home's value as well as a comparison with similar homes in the area
Home Values in the Area
Average Home Value in this Area
Purchase History
| Date | Buyer | Sale Price | Title Company |
|---|---|---|---|
| Martindale Jack A | -- | None Listed On Document | |
| Martindale Jack A | -- | None Listed On Document | |
| Martindale Jack A | -- | None Available | |
| Martindale Jack A | $86,000 | Itc | |
| Howe Tyler | $78,500 | -- |
Source: Public Records
Mortgage History
| Date | Status | Borrower | Loan Amount |
|---|---|---|---|
| Previous Owner | Martindale Jack A | $84,112 | |
| Previous Owner | Howe Tyler | $75,050 | |
| Closed | Martindale Jack A | $0 |
Source: Public Records
Tax History Compared to Growth
Tax History
| Year | Tax Paid | Tax Assessment Tax Assessment Total Assessment is a certain percentage of the fair market value that is determined by local assessors to be the total taxable value of land and additions on the property. | Land | Improvement |
|---|---|---|---|---|
| 2025 | $2,480 | $163,100 | $30,800 | $132,300 |
| 2024 | $2,480 | $143,500 | $26,700 | $116,800 |
| 2023 | $2,532 | $143,500 | $26,700 | $116,800 |
| 2022 | $2,510 | $116,300 | $22,600 | $93,700 |
| 2021 | $2,386 | $116,300 | $22,600 | $93,700 |
| 2020 | $2,474 | $104,200 | $20,200 | $84,000 |
| 2019 | $2,360 | $104,200 | $20,200 | $84,000 |
| 2018 | $2,330 | $96,300 | $18,400 | $77,900 |
| 2017 | $2,008 | $96,300 | $18,400 | $77,900 |
| 2016 | $1,952 | $88,600 | $16,500 | $72,100 |
| 2015 | $1,952 | $88,600 | $16,500 | $72,100 |
| 2014 | $1,876 | $86,800 | $15,900 | $70,900 |
Source: Public Records
Map
Nearby Homes