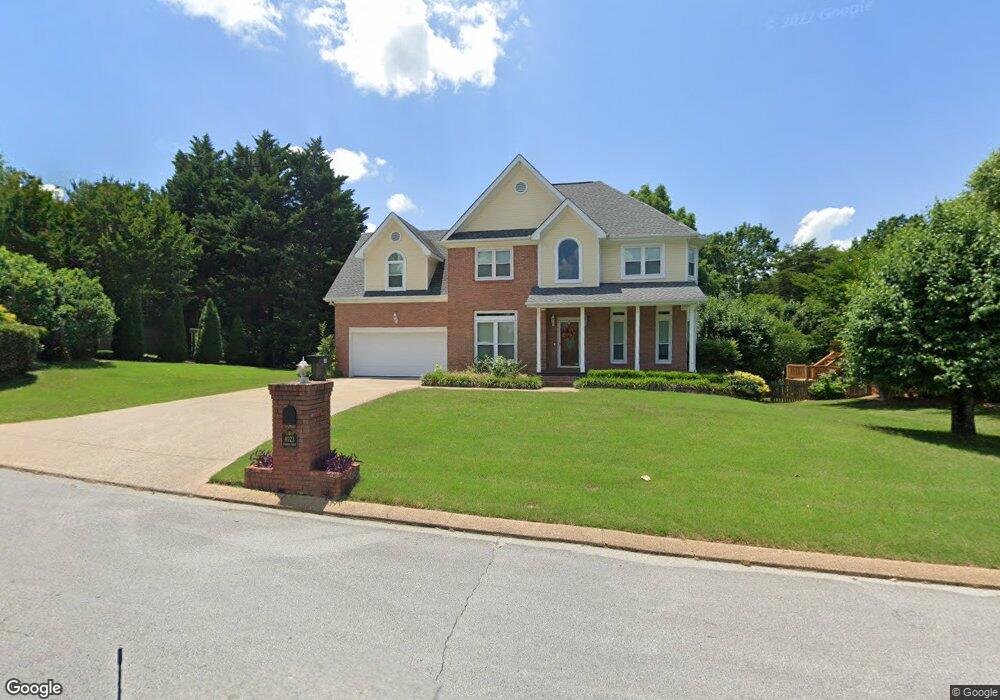
4023 Banner Crest Dr Ooltewah, TN 37363
Estimated Value: $379,000 - $420,000
3
Beds
3
Baths
2,307
Sq Ft
$174/Sq Ft
Est. Value
About This Home
This home is located at 4023 Banner Crest Dr, Ooltewah, TN 37363 and is currently estimated at $401,711, approximately $174 per square foot. 4023 Banner Crest Dr is a home located in Hamilton County with nearby schools including Wallace A. Smith Elementary School, Hunter Middle School, and Ooltewah High School.
Ownership History
Date
Name
Owned For
Owner Type
Purchase Details
Closed on
Feb 3, 2021
Sold by
Smith David L and Smith Janie P
Bought by
Washington Christie N
Current Estimated Value
Home Financials for this Owner
Home Financials are based on the most recent Mortgage that was taken out on this home.
Original Mortgage
$286,711
Outstanding Balance
$255,986
Interest Rate
2.6%
Mortgage Type
FHA
Estimated Equity
$145,725
Purchase Details
Closed on
Jun 30, 1999
Sold by
Alan Lile Scott
Bought by
Smith David L and Smith Janie P
Home Financials for this Owner
Home Financials are based on the most recent Mortgage that was taken out on this home.
Original Mortgage
$123,200
Interest Rate
7.23%
Purchase Details
Closed on
Jul 19, 1995
Sold by
Freeman David L and Freeman Sherry
Bought by
Alan Lile Scott
Create a Home Valuation Report for This Property
The Home Valuation Report is an in-depth analysis detailing your home's value as well as a comparison with similar homes in the area
Home Values in the Area
Average Home Value in this Area
Purchase History
| Date | Buyer | Sale Price | Title Company |
|---|---|---|---|
| Washington Christie N | $292,000 | Warranty Title Insurance Co | |
| Washington Christie N | $292,000 | Warranty Title | |
| Smith David L | $154,000 | Legal Title & Escrow Inc | |
| Alan Lile Scott | $149,000 | -- |
Source: Public Records
Mortgage History
| Date | Status | Borrower | Loan Amount |
|---|---|---|---|
| Open | Washington Christie N | $286,711 | |
| Closed | Washington Christie N | $286,711 | |
| Previous Owner | Smith David L | $123,200 |
Source: Public Records
Tax History Compared to Growth
Tax History
| Year | Tax Paid | Tax Assessment Tax Assessment Total Assessment is a certain percentage of the fair market value that is determined by local assessors to be the total taxable value of land and additions on the property. | Land | Improvement |
|---|---|---|---|---|
| 2024 | $1,407 | $62,900 | $0 | $0 |
| 2023 | $1,416 | $62,900 | $0 | $0 |
| 2022 | $1,416 | $62,900 | $0 | $0 |
| 2021 | $1,416 | $62,900 | $0 | $0 |
| 2020 | $1,515 | $54,450 | $0 | $0 |
| 2019 | $1,515 | $54,450 | $0 | $0 |
| 2018 | $1,515 | $54,450 | $0 | $0 |
| 2017 | $1,515 | $54,450 | $0 | $0 |
| 2016 | $1,434 | $0 | $0 | $0 |
| 2015 | $1,434 | $51,550 | $0 | $0 |
| 2014 | $1,434 | $0 | $0 | $0 |
Source: Public Records
Map
Nearby Homes
- 6514 Flagstone Dr
- 3911 Mt Verd Ln
- 6520 Flagstone Dr
- 6601 Flagstone Dr
- 6920 Knollcrest Dr
- 6747 Sawtooth Dr
- 6026 Hunter Valley Rd
- 6376 Pringle Dr
- 6815 Benwood Dr
- 5916 Riley Rd
- 4133 Flagway Dr
- 4141 Flagway Dr
- 7015 Lystra Rd
- 7242 Garfield Rd
- 6307 Jan Lane Dr
- 6912 Benwood Dr
- 7004 Lystra Rd
- 6830 Buck Trail Dr
- 0 Lodestone Dr
- 7283 Mercedes Ln
- 4023 Banner Crest
- 4021 Banner Crest Dr Unit 11
- 4021 Banner Crest
- 4027 Banner Crest Dr
- 4017 Banner Crest Dr
- 4020 Banner Crest Dr Unit 11
- 4029 Banner Crest Dr
- 4018 Banner Crest Dr
- 6400 Brittany Ln
- 4015 Banner Crest Dr
- 4016 Banner Crest Unit 11
- 4016 Banner Crest
- 4033 Banner Crest Dr
- 4016 Banner Crest Dr
- 6503 Flagstone Dr
- 6506 Flagstone Dr
- 6401 Brittany Ln
- 4011 Banner Crest Dr
- 4012 Banner Crest Dr
- 4012 Banner Crest Dr Unit 11