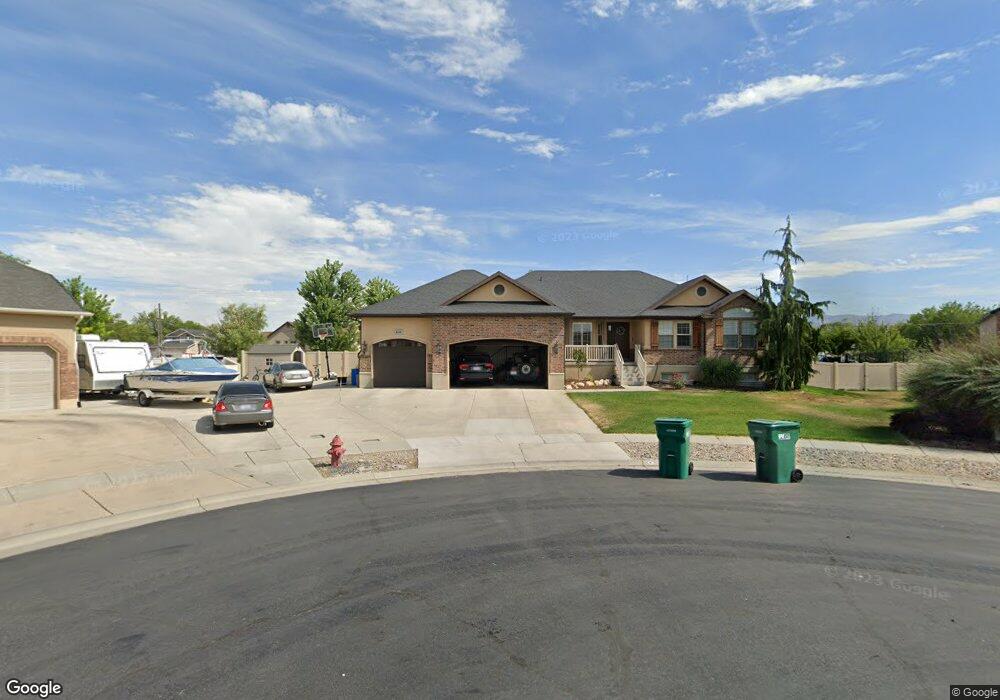
4023 S 5000 W West Haven, UT 84401
Estimated Value: $738,922 - $867,000
5
Beds
4
Baths
3,388
Sq Ft
$233/Sq Ft
Est. Value
About This Home
This home is located at 4023 S 5000 W, West Haven, UT 84401 and is currently estimated at $790,231, approximately $233 per square foot. 4023 S 5000 W is a home located in Weber County with nearby schools including Country View School, Rocky Mountain Junior High School, and Fremont High School.
Ownership History
Date
Name
Owned For
Owner Type
Purchase Details
Closed on
Dec 10, 2012
Sold by
Wayment Lisa Ann and Wayment Kyle Craig
Bought by
Kobbe Steven P
Current Estimated Value
Home Financials for this Owner
Home Financials are based on the most recent Mortgage that was taken out on this home.
Original Mortgage
$327,450
Outstanding Balance
$226,763
Interest Rate
3.36%
Mortgage Type
VA
Estimated Equity
$563,468
Purchase Details
Closed on
Feb 8, 2006
Sold by
Wayment Kyle and Wayment Lisa
Bought by
Wayment Kyle Craig
Home Financials for this Owner
Home Financials are based on the most recent Mortgage that was taken out on this home.
Original Mortgage
$270,000
Interest Rate
6.16%
Mortgage Type
Stand Alone Refi Refinance Of Original Loan
Purchase Details
Closed on
Jun 10, 2005
Sold by
Fair Grove Construction Inc
Bought by
Wayment Kyle
Create a Home Valuation Report for This Property
The Home Valuation Report is an in-depth analysis detailing your home's value as well as a comparison with similar homes in the area
Home Values in the Area
Average Home Value in this Area
Purchase History
| Date | Buyer | Sale Price | Title Company |
|---|---|---|---|
| Kobbe Steven P | -- | American Prefferred Title | |
| Wayment Kyle Craig | -- | Meridian Title Company | |
| Wayment Kyle | -- | Founders Title Company Syrac |
Source: Public Records
Mortgage History
| Date | Status | Borrower | Loan Amount |
|---|---|---|---|
| Open | Kobbe Steven P | $327,450 | |
| Previous Owner | Wayment Kyle Craig | $270,000 |
Source: Public Records
Tax History Compared to Growth
Tax History
| Year | Tax Paid | Tax Assessment Tax Assessment Total Assessment is a certain percentage of the fair market value that is determined by local assessors to be the total taxable value of land and additions on the property. | Land | Improvement |
|---|---|---|---|---|
| 2025 | $498 | $706,917 | $259,337 | $447,580 |
| 2024 | $437 | $382,799 | $142,635 | $240,164 |
| 2023 | $382 | $379,500 | $141,987 | $237,513 |
| 2022 | $2,083 | $402,050 | $141,987 | $260,063 |
| 2021 | $1,357 | $573,000 | $127,266 | $445,734 |
| 2020 | $1,049 | $505,000 | $101,989 | $403,011 |
| 2019 | $818 | $458,000 | $97,007 | $360,993 |
| 2018 | $677 | $430,000 | $91,969 | $338,031 |
| 2017 | $290 | $348,000 | $91,702 | $256,298 |
| 2016 | $250 | $186,669 | $43,109 | $143,560 |
| 2015 | -- | $179,833 | $43,109 | $136,724 |
| 2014 | $2,467 | $163,042 | $43,109 | $119,933 |
Source: Public Records
Map
Nearby Homes
- 4126 S 4950 W
- 3233 S 4975 W Unit 14
- 3223 S 4975 W Unit 15
- 3257 S 4975 W Unit 12
- 3269 S 4975 W Unit 11
- 3238 S 4950 W
- 3243 S 4950 W Unit 25
- 3263 S 4950 W Unit 24
- 3225 S 4950 W Unit 26
- 3198 S 4950 W Unit 29
- 3192 S 4950 W Unit 28
- 4712 W 4100 S
- 3731 S 4975 W
- 3191 S 5100 St W Unit 1
- 5389 W 3850 S Unit 22
- 5417 W 3850 S
- 4111 S 5350 W
- 4521 W 3950 S Unit 5
- 4512 W 3925 S Unit 20
- 4941 W 3575 S
- 4018 S 5000 W
- 4033 S 5000 W
- 4026 S 5000 W
- 4026 S 5000 W Unit 75
- 4024 S 5025 W
- 4032 S 5025 W
- 4034 S 5000 W
- 4034 S 5000 W Unit 74
- 4998 W 4000 S
- 4020 S 5025 W
- 4051 S 5000 W
- 4046 S 5000 W
- 4052 S 5025 W
- 5018 W 4000 S
- 4045 S 4950 W
- 4045 S 4950 W Unit 61
- 4021 S 5025 W
- 4944 W 4000 S
- 4944 W 4000 S
- 4035 S 5025 W