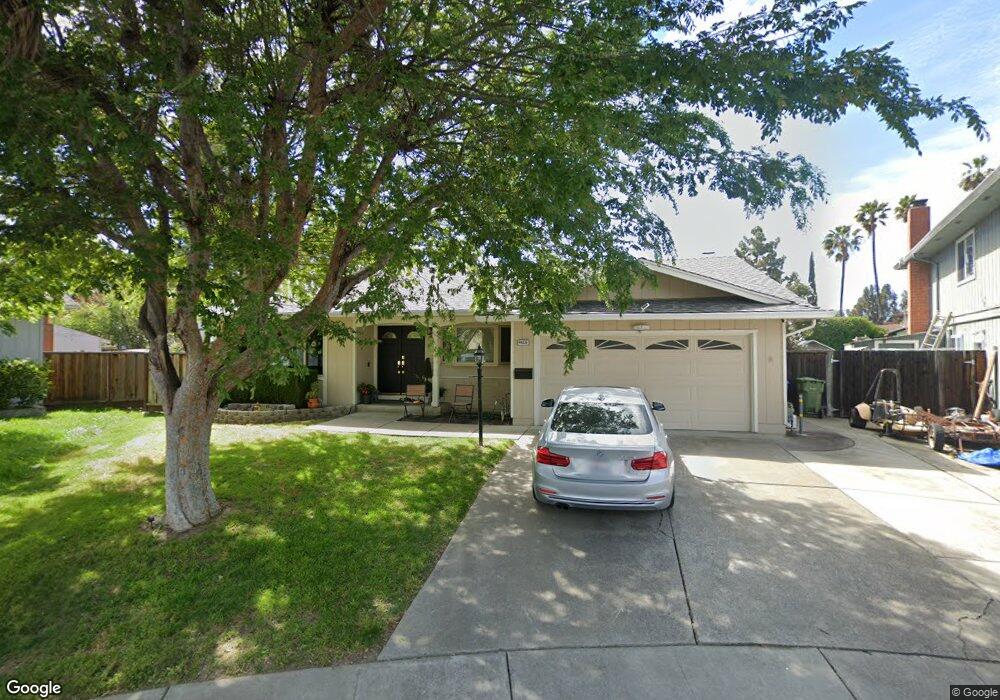
40235 Hacienda Ct Fremont, CA 94539
Kimber-Gomes NeighborhoodEstimated Value: $2,247,000 - $3,024,000
4
Beds
3
Baths
2,389
Sq Ft
$1,127/Sq Ft
Est. Value
About This Home
This home is located at 40235 Hacienda Ct, Fremont, CA 94539 and is currently estimated at $2,693,324, approximately $1,127 per square foot. 40235 Hacienda Ct is a home located in Alameda County with nearby schools including John Gomes Elementary School, William Hopkins Junior High School, and Mission San Jose High School.
Ownership History
Date
Name
Owned For
Owner Type
Purchase Details
Closed on
Jun 11, 2018
Sold by
Collanton Paul R and Collanton Laurie L
Bought by
Ding Weiwei and Liu Melying
Current Estimated Value
Home Financials for this Owner
Home Financials are based on the most recent Mortgage that was taken out on this home.
Original Mortgage
$1,503,000
Outstanding Balance
$1,280,836
Interest Rate
3.87%
Mortgage Type
Adjustable Rate Mortgage/ARM
Estimated Equity
$1,412,488
Purchase Details
Closed on
Jun 9, 1997
Sold by
Ko Gregory
Bought by
Collanton Paul R and Collanton Laurie L
Home Financials for this Owner
Home Financials are based on the most recent Mortgage that was taken out on this home.
Original Mortgage
$295,000
Interest Rate
7.98%
Purchase Details
Closed on
Jul 14, 1995
Sold by
Ko Gregory
Bought by
Ko Gregory
Home Financials for this Owner
Home Financials are based on the most recent Mortgage that was taken out on this home.
Original Mortgage
$155,000
Interest Rate
7.59%
Create a Home Valuation Report for This Property
The Home Valuation Report is an in-depth analysis detailing your home's value as well as a comparison with similar homes in the area
Home Values in the Area
Average Home Value in this Area
Purchase History
| Date | Buyer | Sale Price | Title Company |
|---|---|---|---|
| Ding Weiwei | $1,880,000 | Chicago Title Company | |
| Collanton Paul R | $395,000 | North American Title Co | |
| Ko Gregory | -- | Placer Title Company |
Source: Public Records
Mortgage History
| Date | Status | Borrower | Loan Amount |
|---|---|---|---|
| Open | Ding Weiwei | $1,503,000 | |
| Previous Owner | Collanton Paul R | $295,000 | |
| Previous Owner | Ko Gregory | $155,000 |
Source: Public Records
Tax History Compared to Growth
Tax History
| Year | Tax Paid | Tax Assessment Tax Assessment Total Assessment is a certain percentage of the fair market value that is determined by local assessors to be the total taxable value of land and additions on the property. | Land | Improvement |
|---|---|---|---|---|
| 2025 | $24,581 | $2,139,081 | $641,724 | $1,497,357 |
| 2024 | $24,581 | $2,097,140 | $629,142 | $1,467,998 |
| 2023 | $23,959 | $2,056,024 | $616,807 | $1,439,217 |
| 2022 | $23,700 | $2,015,717 | $604,715 | $1,411,002 |
| 2021 | $23,107 | $1,976,198 | $592,859 | $1,383,339 |
| 2020 | $23,336 | $1,955,951 | $586,785 | $1,369,166 |
| 2019 | $23,062 | $1,917,600 | $575,280 | $1,342,320 |
| 2018 | $7,859 | $626,006 | $169,614 | $456,392 |
| 2017 | $7,662 | $613,734 | $166,289 | $447,445 |
| 2016 | $7,528 | $601,703 | $163,029 | $438,674 |
| 2015 | $7,425 | $592,667 | $160,581 | $432,086 |
| 2014 | $7,295 | $581,060 | $157,436 | $423,624 |
Source: Public Records
Map
Nearby Homes
- 40613 Encanto Way
- 40743 Rainwater Ct Unit 80
- 1401 Lemos Ln
- 39478 Zacate Ave
- 260 Jacaranda Dr
- 39331 Marbella Terraza
- 1123 Farragut Dr
- 1962 Briscoe Terrace
- 39285 Marbella Terraza Unit 9P
- 1910 Barrymore Common Unit C
- 1960 Barrymore Common Unit K
- 41043 Joyce Ave
- 41246 Mission Blvd
- 39199 Guardino Dr Unit 170
- 39199 Guardino Dr Unit 371
- 39199 Guardino Dr Unit 179
- 41252 Mission Blvd
- 40469 Shaw Ct
- 39149 Guardino Dr Unit 247
- 39239 Walnut Terrace
- 40231 Hacienda Ct
- 652 San Carlos Ct
- 40236 Hacienda Ct
- 678 San Carlos Ct
- 626 San Carlos Ct
- 40232 Hacienda Ct
- 40227 Hacienda Ct
- 40147 San Carlos Place
- 704 San Carlos Ct
- 40145 San Carlos Place
- 40228 Hacienda Ct
- 40153 San Carlos Place
- 40223 Hacienda Ct
- 639 San Carlos Ct
- 40224 Hacienda Ct
- 730 San Carlos Ct
- 40161 San Carlos Place
- 739 Seville Place
- 763 Seville Place
- 715 Seville Place