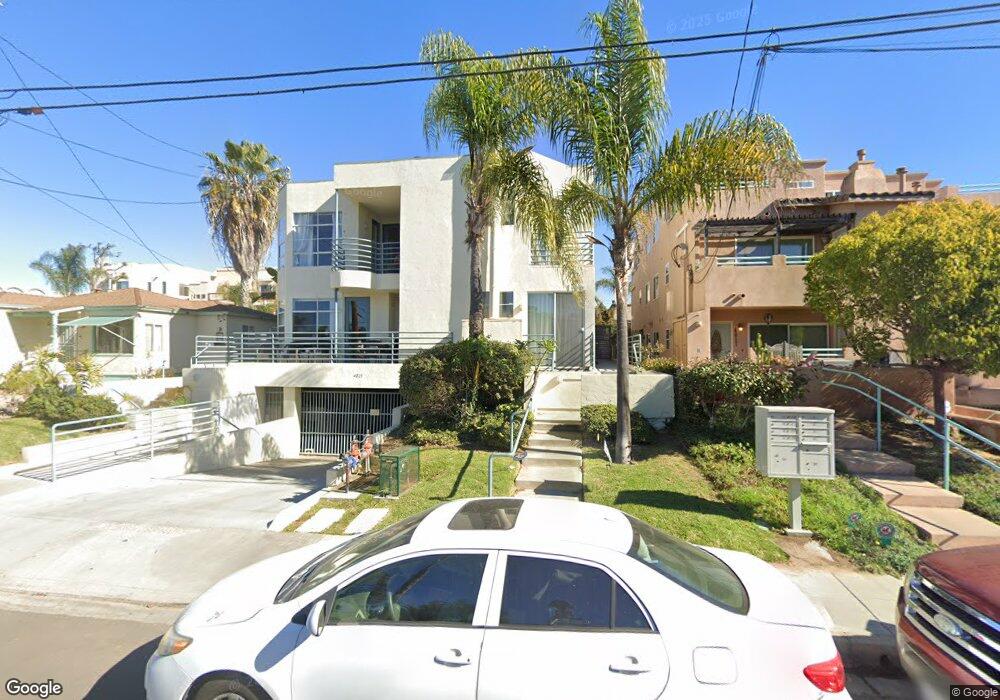
4025 Gresham St Unit 3 San Diego, CA 92109
Pacific Beach NeighborhoodEstimated Value: $1,131,328 - $1,384,000
3
Beds
3
Baths
1,367
Sq Ft
$915/Sq Ft
Est. Value
About This Home
This home is located at 4025 Gresham St Unit 3, San Diego, CA 92109 and is currently estimated at $1,251,082, approximately $915 per square foot. 4025 Gresham St Unit 3 is a home located in San Diego County with nearby schools including Crown Point Junior Music Academy, Pacific Beach Middle, and Mission Bay High School.
Ownership History
Date
Name
Owned For
Owner Type
Purchase Details
Closed on
May 10, 2018
Sold by
Kabay John K and Kabay Barbara L
Bought by
Kabay John K and Kabay Barbara L
Current Estimated Value
Purchase Details
Closed on
Mar 15, 2002
Sold by
Hanlon William F and Harris John F
Bought by
Kabay John K and Kabay Barbara L
Purchase Details
Closed on
Dec 10, 2000
Sold by
Hanlon William J
Bought by
Hanlon William J
Purchase Details
Closed on
Sep 14, 1999
Sold by
Conway Mary I W and Waterman Mary Irene
Bought by
Hanlon William J
Home Financials for this Owner
Home Financials are based on the most recent Mortgage that was taken out on this home.
Original Mortgage
$251,000
Interest Rate
7.87%
Purchase Details
Closed on
Feb 17, 1995
Sold by
Conway Michael James
Bought by
Conway Mary Irene Waterman
Create a Home Valuation Report for This Property
The Home Valuation Report is an in-depth analysis detailing your home's value as well as a comparison with similar homes in the area
Home Values in the Area
Average Home Value in this Area
Purchase History
| Date | Buyer | Sale Price | Title Company |
|---|---|---|---|
| Kabay John K | -- | None Available | |
| Kabay John K | $427,000 | Commonwealth Land Title | |
| Hanlon William J | -- | -- | |
| Hanlon William J | $251,000 | Chicago Title Co | |
| Conway Mary Irene Waterman | -- | -- |
Source: Public Records
Mortgage History
| Date | Status | Borrower | Loan Amount |
|---|---|---|---|
| Previous Owner | Hanlon William J | $251,000 |
Source: Public Records
Tax History Compared to Growth
Tax History
| Year | Tax Paid | Tax Assessment Tax Assessment Total Assessment is a certain percentage of the fair market value that is determined by local assessors to be the total taxable value of land and additions on the property. | Land | Improvement |
|---|---|---|---|---|
| 2025 | $7,626 | $630,789 | $443,181 | $187,608 |
| 2024 | $7,626 | $618,422 | $434,492 | $183,930 |
| 2023 | $7,459 | $606,297 | $425,973 | $180,324 |
| 2022 | $7,261 | $594,410 | $417,621 | $176,789 |
| 2021 | $7,211 | $582,756 | $409,433 | $173,323 |
| 2020 | $7,124 | $576,781 | $405,235 | $171,546 |
| 2019 | $6,997 | $565,473 | $397,290 | $168,183 |
| 2018 | $6,542 | $554,386 | $389,500 | $164,886 |
| 2017 | $80 | $543,516 | $381,863 | $161,653 |
| 2016 | $6,285 | $532,860 | $374,376 | $158,484 |
| 2015 | $6,193 | $524,857 | $368,753 | $156,104 |
| 2014 | $6,096 | $514,577 | $361,530 | $153,047 |
Source: Public Records
Map
Nearby Homes
- 3986 Riviera Dr
- 4016 Gresham St Unit C2
- 4071 Riviera Dr
- 4070 Riviera Dr Unit 6
- 4073 Riviera Dr
- 4037 Haines St
- 3920 Riviera Dr Unit A
- 1323 Pacific Beach Dr Unit F
- 3850 Riviera Dr Unit 3B
- 3843 Riviera Dr Unit 1
- 3943 Ingraham St
- 4135 Fanuel St
- 3828 Riviera Dr Unit 2B
- 4007 Everts St Unit 3G
- 4007 Everts St Unit 4H
- 1177 Pacific Beach Dr Unit A
- 4053-55 Jewell St
- 1341 Thomas Ave
- 1145 Pacific Beach Dr Unit 107
- 1654 Oliver Ave Unit 6
- 4025 Gresham St Unit 4
- 4025 Gresham St Unit 2
- 4025 Gresham St Unit 1
- 4035 Gresham St Unit 39
- 4013 Gresham St
- 4019 Gresham St
- 4017 Gresham St Unit LU2
- 4015 Gresham St
- 4007 Gresham St Unit B
- 4007 Gresham St Unit A
- 4009 Gresham St
- 4041 Gresham St Unit 43
- 4026 Riviera Dr
- 4026 Riviera Dr Unit 4
- 4026 Riviera Dr Unit 3
- 4026 Riviera Dr Unit 2
- 4026 Riviera Dr Unit 1
- 4032 Riviera Dr
- 4034 Riviera Dr
- 4036 Riviera Dr