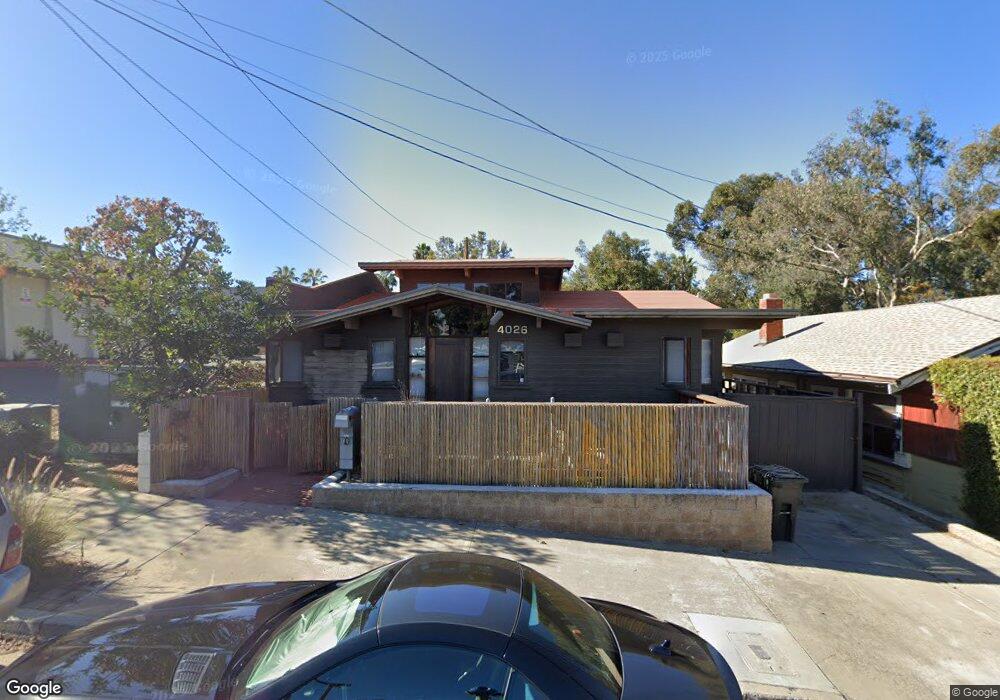
4026 Dove St San Diego, CA 92103
Hillcrest NeighborhoodEstimated Value: $965,549
--
Bed
--
Bath
1,112
Sq Ft
$868/Sq Ft
Est. Value
About This Home
This home is located at 4026 Dove St, San Diego, CA 92103 and is currently estimated at $965,549, approximately $868 per square foot. 4026 Dove St is a home located in San Diego County with nearby schools including Grant K-8, Richard Henry Dana Middle School, and Roosevelt International Middle School.
Ownership History
Date
Name
Owned For
Owner Type
Purchase Details
Closed on
Nov 12, 2018
Sold by
Barbera David
Bought by
Barbera David
Current Estimated Value
Purchase Details
Closed on
Dec 18, 2014
Sold by
Wing California Real Estate Inc
Bought by
Barbera David
Purchase Details
Closed on
Apr 8, 2011
Sold by
Brav Nelson and Schwartz Steven
Bought by
Wing California Real Estate Inc
Purchase Details
Closed on
Jan 14, 2000
Sold by
Schwartz Deborah
Bought by
Schwartz Steven N
Purchase Details
Closed on
Jan 7, 1997
Sold by
Brav Nelson P and Schwartz Steven
Bought by
Schwartz Nelson and Schwartz Steven
Home Financials for this Owner
Home Financials are based on the most recent Mortgage that was taken out on this home.
Original Mortgage
$142,000
Interest Rate
7.46%
Mortgage Type
Commercial
Create a Home Valuation Report for This Property
The Home Valuation Report is an in-depth analysis detailing your home's value as well as a comparison with similar homes in the area
Home Values in the Area
Average Home Value in this Area
Purchase History
| Date | Buyer | Sale Price | Title Company |
|---|---|---|---|
| Barbera David | -- | None Available | |
| Barbera David | $480,000 | First American Title Ins Co | |
| Wing California Real Estate Inc | $380,000 | Chicago Title Co | |
| Schwartz Steven N | -- | Commonwealth Land Title Co | |
| Schwartz Nelson | -- | -- | |
| Brav Nelson P | -- | -- | |
| Schwartz Steven N | -- | -- |
Source: Public Records
Mortgage History
| Date | Status | Borrower | Loan Amount |
|---|---|---|---|
| Previous Owner | Schwartz Nelson | $142,000 |
Source: Public Records
Tax History Compared to Growth
Tax History
| Year | Tax Paid | Tax Assessment Tax Assessment Total Assessment is a certain percentage of the fair market value that is determined by local assessors to be the total taxable value of land and additions on the property. | Land | Improvement |
|---|---|---|---|---|
| 2025 | $7,088 | $576,880 | $480,737 | $96,143 |
| 2024 | $7,088 | $565,569 | $471,311 | $94,258 |
| 2023 | $6,919 | $554,480 | $462,070 | $92,410 |
| 2022 | $6,731 | $543,609 | $453,010 | $90,599 |
| 2021 | $6,681 | $532,951 | $444,128 | $88,823 |
| 2020 | $6,599 | $527,488 | $439,575 | $87,913 |
| 2019 | $6,482 | $517,146 | $430,956 | $86,190 |
| 2018 | $6,063 | $507,006 | $422,506 | $84,500 |
| 2017 | $5,919 | $497,066 | $414,222 | $82,844 |
| 2016 | $5,825 | $487,320 | $406,100 | $81,220 |
| 2015 | $4,859 | $405,080 | $245,180 | $159,900 |
| 2014 | $4,783 | $397,146 | $240,378 | $156,768 |
Source: Public Records
Map
Nearby Homes
- 4055 Eagle St Unit 102
- 3963 Eagle St Unit 8
- 845 Fort Stockton Dr Unit 308
- 4057 Brant St Unit 8
- 720 W Lewis St Unit 6
- 4095 Albatross St
- 4109 Ibis St
- 0 Bush St Unit (35-38) 240005385
- 4171 Ibis St
- 3852-56 1st Ave
- 3830 1st Ave Unit 13
- 4077 3rd Ave Unit 102
- 811 W Pennsylvania Ave
- 3740 3rd Ave Unit 4
- 4209 15 3rd Ave
- 4217 21 3rd Ave
- 4193 4th Ave
- Lot 19 Randolph St
- 4396 Arcadia Dr
- 3774 5th Ave Unit 7-10
- 4036 Dove St Unit 38
- 4025 Eagle St
- 4035 Eagle St
- 4045 Eagle St
- 630 W Washington St
- 4055 Eagle St
- 4055 Eagle St Unit 303
- 4055 Eagle St Unit 302
- 4055 Eagle St Unit 301
- 4055 Eagle St Unit 204
- 4055 Eagle St Unit 203
- 4055 Eagle St Unit 202
- 4055 Eagle St Unit 201
- 4055 Eagle St Unit 104
- 4055 Eagle St Unit 103
- 4055 Eagle St Unit 101
- 4032 Eagle St
- 4063 Eagle St
- 4044 Eagle St
- 4024 Eagle St