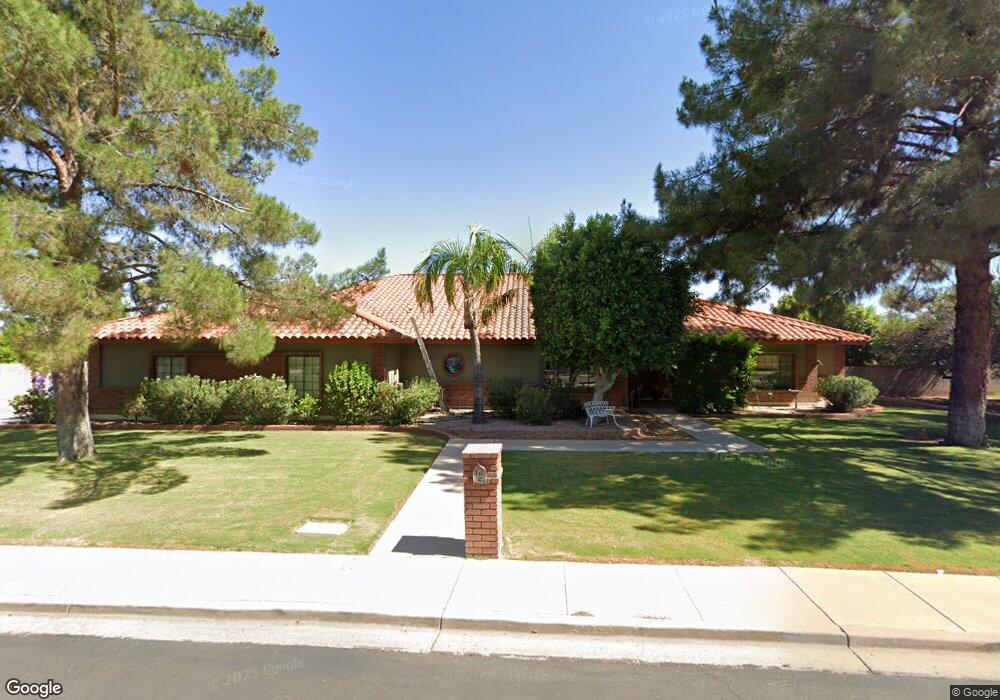
4026 E Grove Cir Mesa, AZ 85206
Central Mesa NeighborhoodEstimated Value: $675,000 - $815,000
--
Bed
4
Baths
3,481
Sq Ft
$217/Sq Ft
Est. Value
About This Home
This home is located at 4026 E Grove Cir, Mesa, AZ 85206 and is currently estimated at $754,340, approximately $216 per square foot. 4026 E Grove Cir is a home located in Maricopa County with nearby schools including Franklin at Brimhall Elementary School, Wilson Elementary School, and Franklin West Elementary School.
Ownership History
Date
Name
Owned For
Owner Type
Purchase Details
Closed on
Aug 1, 2022
Sold by
Arnett Dennis W
Bought by
Arnett Jonathan and Arnett Holly
Current Estimated Value
Home Financials for this Owner
Home Financials are based on the most recent Mortgage that was taken out on this home.
Original Mortgage
$430,000
Outstanding Balance
$410,406
Interest Rate
5.3%
Mortgage Type
New Conventional
Estimated Equity
$343,934
Purchase Details
Closed on
Mar 17, 2010
Sold by
Arnett Dennis W and Arnett Karen L
Bought by
Arnett Dennis W
Home Financials for this Owner
Home Financials are based on the most recent Mortgage that was taken out on this home.
Original Mortgage
$477,000
Interest Rate
4.88%
Mortgage Type
Reverse Mortgage Home Equity Conversion Mortgage
Create a Home Valuation Report for This Property
The Home Valuation Report is an in-depth analysis detailing your home's value as well as a comparison with similar homes in the area
Home Values in the Area
Average Home Value in this Area
Purchase History
| Date | Buyer | Sale Price | Title Company |
|---|---|---|---|
| Arnett Jonathan | $700,000 | New Title Company Name | |
| Arnett Dennis W | -- | Placer Title Company |
Source: Public Records
Mortgage History
| Date | Status | Borrower | Loan Amount |
|---|---|---|---|
| Open | Arnett Jonathan | $430,000 | |
| Previous Owner | Arnett Dennis W | $477,000 |
Source: Public Records
Tax History Compared to Growth
Tax History
| Year | Tax Paid | Tax Assessment Tax Assessment Total Assessment is a certain percentage of the fair market value that is determined by local assessors to be the total taxable value of land and additions on the property. | Land | Improvement |
|---|---|---|---|---|
| 2025 | $3,173 | $38,211 | -- | -- |
| 2024 | $3,208 | $36,391 | -- | -- |
| 2023 | $3,208 | $52,600 | $10,520 | $42,080 |
| 2022 | $3,138 | $41,510 | $8,300 | $33,210 |
| 2021 | $3,223 | $41,250 | $8,250 | $33,000 |
| 2020 | $3,180 | $40,170 | $8,030 | $32,140 |
| 2019 | $2,946 | $38,400 | $7,680 | $30,720 |
| 2018 | $2,813 | $34,530 | $6,900 | $27,630 |
| 2017 | $2,725 | $31,960 | $6,390 | $25,570 |
| 2016 | $2,675 | $32,770 | $6,550 | $26,220 |
| 2015 | $2,526 | $32,080 | $6,410 | $25,670 |
Source: Public Records
Map
Nearby Homes
- 1350 S Greenfield Rd Unit 2191
- 1350 S Greenfield Rd Unit 2023
- 1350 S Greenfield Rd Unit 2159
- 1350 S Greenfield Rd Unit 1084
- 1350 S Greenfield Rd Unit 2205
- 1350 S Greenfield Rd Unit 1103
- 1350 S Greenfield Rd Unit 1175
- 1350 S Greenfield Rd Unit 1152
- 1150 S Oakland Unit 2
- 4107 E Fairview Cir
- 3758 E Harmony Ave
- 3761 E Holmes Ave
- 1811 S 39th St Unit 5
- 1811 S 39th St Unit 73
- 1021 S Greenfield Rd Unit 1194
- 1021 S Greenfield Rd Unit 1165
- 1021 S Greenfield Rd Unit 1080
- 1021 S Greenfield Rd Unit 1045
- 1021 S Greenfield Rd Unit 1148
- 1021 S Greenfield Rd Unit 1106
- 4025 E Glade Cir
- 4040 E Grove Cir
- 4010 E Grove Cir
- 4009 E Glade Cir
- 4027 E Grove Cir
- 4039 E Glade Cir
- 4041 E Grove Cir
- 4011 E Grove Cir
- 4054 E Grove Cir
- 1410 S Jackson Cir
- 4024 E Glade Cir
- 4053 E Glade Cir
- 4008 E Glade Cir
- 4055 E Grove Cir
- 1344 S Nassau
- 1411 S Jackson Cir
- 1330 S Nassau
- 4038 E Glade Cir
- 1316 S Nassau
- 1409 S Nassau