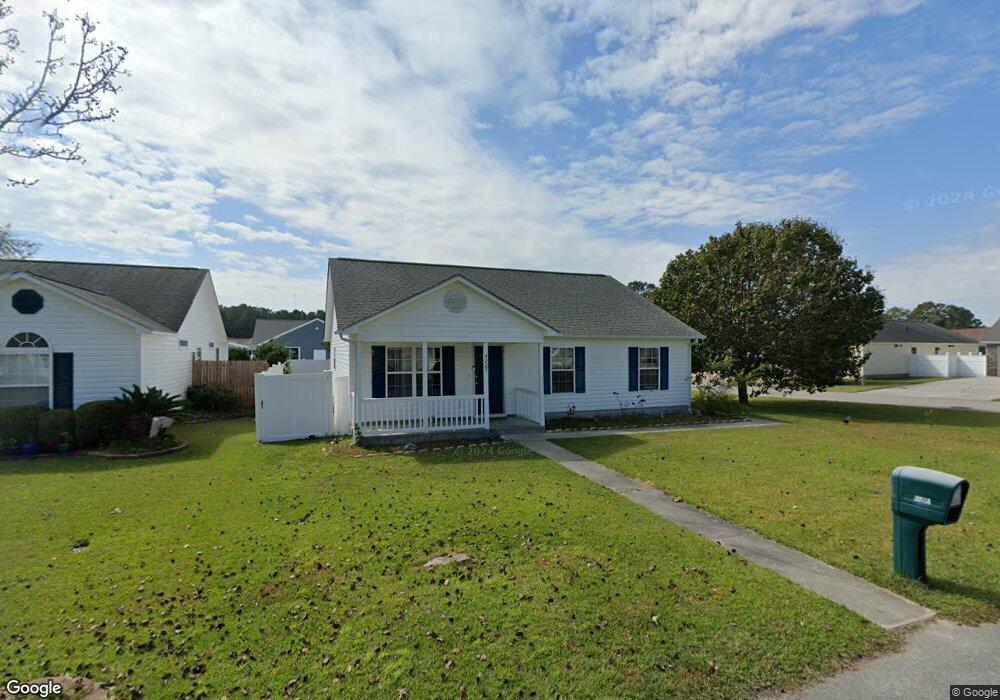
4027 Douglas Fir Ln Murrells Inlet, SC 29576
Burgess NeighborhoodEstimated Value: $271,035 - $288,000
3
Beds
2
Baths
1,260
Sq Ft
$221/Sq Ft
Est. Value
About This Home
This home is located at 4027 Douglas Fir Ln, Murrells Inlet, SC 29576 and is currently estimated at $278,009, approximately $220 per square foot. 4027 Douglas Fir Ln is a home located in Horry County with nearby schools including St. James Elementary School, St. James Middle School, and St. James Intermediate.
Ownership History
Date
Name
Owned For
Owner Type
Purchase Details
Closed on
Jun 30, 2022
Sold by
Lanier Stacy Blair
Bought by
Carter Paul Daniel and Carter Melsia S
Current Estimated Value
Home Financials for this Owner
Home Financials are based on the most recent Mortgage that was taken out on this home.
Original Mortgage
$250,635
Outstanding Balance
$238,451
Interest Rate
5.09%
Mortgage Type
VA
Estimated Equity
$39,558
Purchase Details
Closed on
Aug 14, 2008
Sold by
Whitesides Gail B
Bought by
Lanier Stacy Blair
Purchase Details
Closed on
Apr 7, 2008
Sold by
Whitesides Harold E
Bought by
Whitesides Gail B
Purchase Details
Closed on
Aug 1, 2003
Sold by
Martin Wesley A
Bought by
Whitesides Harold E and Whitesides Gail B
Home Financials for this Owner
Home Financials are based on the most recent Mortgage that was taken out on this home.
Original Mortgage
$114,450
Interest Rate
5.42%
Mortgage Type
VA
Purchase Details
Closed on
Oct 11, 2002
Sold by
Majors Frederick F
Bought by
Martin Wesley A
Create a Home Valuation Report for This Property
The Home Valuation Report is an in-depth analysis detailing your home's value as well as a comparison with similar homes in the area
Home Values in the Area
Average Home Value in this Area
Purchase History
| Date | Buyer | Sale Price | Title Company |
|---|---|---|---|
| Carter Paul Daniel | $245,000 | -- | |
| Lanier Stacy Blair | $135,000 | -- | |
| Whitesides Gail B | -- | -- | |
| Whitesides Harold E | $112,229 | -- | |
| Martin Wesley A | $22,000 | -- |
Source: Public Records
Mortgage History
| Date | Status | Borrower | Loan Amount |
|---|---|---|---|
| Open | Carter Paul Daniel | $250,635 | |
| Previous Owner | Whitesides Harold E | $114,450 |
Source: Public Records
Tax History Compared to Growth
Tax History
| Year | Tax Paid | Tax Assessment Tax Assessment Total Assessment is a certain percentage of the fair market value that is determined by local assessors to be the total taxable value of land and additions on the property. | Land | Improvement |
|---|---|---|---|---|
| 2024 | $1,081 | $10,795 | $3,267 | $7,528 |
| 2023 | $1,081 | $8,190 | $1,783 | $6,407 |
| 2021 | $1,831 | $6,169 | $1,237 | $4,932 |
| 2020 | $1,724 | $6,169 | $1,237 | $4,932 |
| 2019 | $1,724 | $6,169 | $1,237 | $4,932 |
| 2018 | $1,559 | $4,748 | $1,032 | $3,716 |
| 2017 | $1,544 | $4,748 | $1,032 | $3,716 |
| 2016 | -- | $4,748 | $1,032 | $3,716 |
| 2015 | $1,544 | $4,748 | $1,032 | $3,716 |
| 2014 | $1,493 | $4,748 | $1,032 | $3,716 |
Source: Public Records
Map
Nearby Homes
- 9856 Conifer Ln
- 1019 Autumn Dr
- 1013 Autumn Dr
- 5008 Blue Spruce Ln
- 1007 Autumn Dr
- 8065 Resin Rd
- 8069 Resin Rd
- 5553 Grape Arbor Ln
- 10141 McDowell Shortcut Rd
- 502 Haven View Way
- 506 Haven View Way
- LITCHFIELD Plan at Haven View
- HARBOR OAK Plan at Haven View
- 9687 Indigo Creek Blvd
- 9681 Indigo Creek Blvd
- 9691 Indigo Creek Blvd
- 9696 Indigo Creek Blvd
- 9692 Indigo Creek Blvd
- 9716 Indigo Creek Blvd
- 9703 Indigo Creek Blvd
- 4023 Douglas Fir Ln
- 1020 White Cedar Ln
- 4019 Douglas Fir Ln
- 1016 White Cedar Ln
- 9860 Conifer Ln
- 9864 Conifer Ln
- 4024 Douglas Fir Ln
- 4015 Douglas Fir Ln
- 9852 Conifer Ln
- 4028 Douglas Fir Ln
- 1012 White Cedar Ln
- 9868 Conifer Ln
- 4020 Douglas Fir Ln
- 9848 Conifer Ln
- 9848 Conifer Ln Unit Lot 325 The Pines @
- 9872 Conifer Ln
- 4016 Douglas Fir Ln
- 4011 Douglas Fir Ln
- 1008 White Cedar Ln
- 8011 Tag Ct