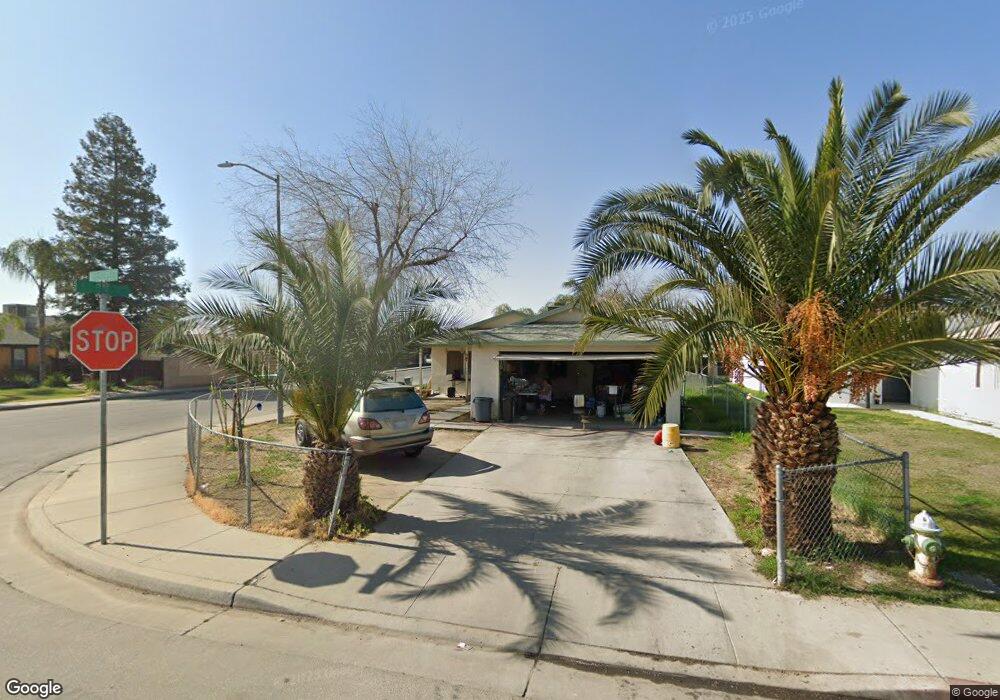
403 10th St Unit 633 Mc Farland, CA 93250
Estimated Value: $279,000 - $323,000
3
Beds
2
Baths
1,094
Sq Ft
$274/Sq Ft
Est. Value
About This Home
This home is located at 403 10th St Unit 633, Mc Farland, CA 93250 and is currently estimated at $300,113, approximately $274 per square foot. 403 10th St Unit 633 is a home located in Kern County with nearby schools including McFarland High School.
Ownership History
Date
Name
Owned For
Owner Type
Purchase Details
Closed on
Oct 19, 2023
Sold by
Herrera Daniela
Bought by
Hernandez Lopez Wilver A
Current Estimated Value
Home Financials for this Owner
Home Financials are based on the most recent Mortgage that was taken out on this home.
Original Mortgage
$205,524
Interest Rate
7.12%
Mortgage Type
FHA
Purchase Details
Closed on
Oct 12, 2023
Sold by
Tesoro Properties Inc
Bought by
Hernandez Lopez Wilver A
Home Financials for this Owner
Home Financials are based on the most recent Mortgage that was taken out on this home.
Original Mortgage
$205,524
Interest Rate
7.12%
Mortgage Type
FHA
Purchase Details
Closed on
May 20, 2021
Sold by
Westhoff Gordon and The Leach Family Trust
Bought by
Tesoro Properties Inc
Home Financials for this Owner
Home Financials are based on the most recent Mortgage that was taken out on this home.
Original Mortgage
$130,000
Interest Rate
2.9%
Mortgage Type
Commercial
Purchase Details
Closed on
Sep 9, 1997
Sold by
Leach Earl F and Leach Jean A
Bought by
Leach Earl F and Leach Jean A
Create a Home Valuation Report for This Property
The Home Valuation Report is an in-depth analysis detailing your home's value as well as a comparison with similar homes in the area
Home Values in the Area
Average Home Value in this Area
Purchase History
| Date | Buyer | Sale Price | Title Company |
|---|---|---|---|
| Hernandez Lopez Wilver A | -- | Stewart Title | |
| Hernandez Lopez Wilver A | $295,000 | Stewart Title | |
| Tesoro Properties Inc | $165,000 | First American Title Company | |
| Leach Earl F | -- | -- |
Source: Public Records
Mortgage History
| Date | Status | Borrower | Loan Amount |
|---|---|---|---|
| Open | Hernandez Lopez Wilver A | $107,000 | |
| Previous Owner | Hernandez Lopez Wilver A | $205,524 | |
| Previous Owner | Tesoro Properties Inc | $130,000 |
Source: Public Records
Tax History Compared to Growth
Tax History
| Year | Tax Paid | Tax Assessment Tax Assessment Total Assessment is a certain percentage of the fair market value that is determined by local assessors to be the total taxable value of land and additions on the property. | Land | Improvement |
|---|---|---|---|---|
| 2025 | $2,215 | $300,888 | $90,266 | $210,622 |
| 2024 | $2,181 | $175,098 | $53,060 | $122,038 |
| 2023 | $2,181 | $171,666 | $52,020 | $119,646 |
| 2022 | $2,130 | $168,300 | $51,000 | $117,300 |
| 2021 | $1,723 | $137,065 | $30,917 | $106,148 |
| 2020 | $1,669 | $135,660 | $30,600 | $105,060 |
| 2019 | $1,070 | $89,823 | $11,758 | $78,065 |
| 2018 | $1,057 | $86,337 | $11,302 | $75,035 |
| 2017 | $1,031 | $84,645 | $11,081 | $73,564 |
| 2016 | $1,018 | $82,986 | $10,864 | $72,122 |
| 2015 | $1,000 | $81,740 | $10,701 | $71,039 |
| 2014 | $959 | $80,140 | $10,492 | $69,648 |
Source: Public Records
Map
Nearby Homes
- 450 8th St
- 539 11th St
- 314 8th St
- 733 Ensenata Dr
- 0 W Sherwood Ave Unit 202506495
- 0 W Sherwood Ave Unit 21453658
- 124 4th Place
- 249 Robertson Ave
- 737 Misty Ave
- 830 Davis Ave
- 13271 Garzoli Ave
- Floorplan 2000 AP at Tierra Del Sol
- Floorplan 1700 at Tierra Del Sol
- Floorplan 1810 at Tierra Del Sol
- Floorplan 1523 at Tierra Del Sol
- Floorplan 1320 at Tierra Del Sol
- Floorplan 1275 at Tierra Del Sol
- 583 Taylor Ave
- 276 San Juan St
- 254 E Sherwood Ave