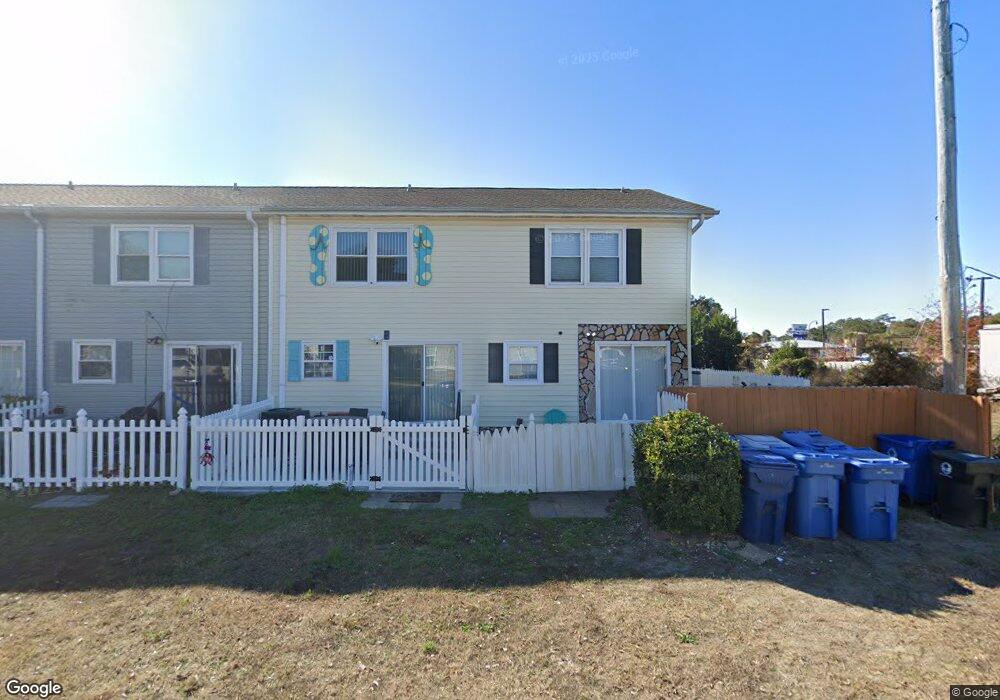
403 2nd Ave N Unit E Myrtle Beach, SC 29577
Downtown Myrtle Beach NeighborhoodEstimated Value: $243,472 - $287,000
2
Beds
2
Baths
1,088
Sq Ft
$246/Sq Ft
Est. Value
About This Home
This home is located at 403 2nd Ave N Unit E, Myrtle Beach, SC 29577 and is currently estimated at $267,868, approximately $246 per square foot. 403 2nd Ave N Unit E is a home located in Horry County with nearby schools including Myrtle Beach Child Development Center, Myrtle Beach Primary School, and Myrtle Beach Elementary School.
Ownership History
Date
Name
Owned For
Owner Type
Purchase Details
Closed on
Mar 30, 2022
Sold by
Petersen Sharon
Bought by
Petersen Sharon and Petersen Savannah
Current Estimated Value
Purchase Details
Closed on
Apr 26, 2007
Sold by
James Kathy A and James Charlie V
Bought by
Smith Peterson Sharon W
Create a Home Valuation Report for This Property
The Home Valuation Report is an in-depth analysis detailing your home's value as well as a comparison with similar homes in the area
Home Values in the Area
Average Home Value in this Area
Purchase History
| Date | Buyer | Sale Price | Title Company |
|---|---|---|---|
| Petersen Sharon | -- | -- | |
| Smith Peterson Sharon W | $36,584 | None Available |
Source: Public Records
Tax History Compared to Growth
Tax History
| Year | Tax Paid | Tax Assessment Tax Assessment Total Assessment is a certain percentage of the fair market value that is determined by local assessors to be the total taxable value of land and additions on the property. | Land | Improvement |
|---|---|---|---|---|
| 2024 | $657 | $11,324 | $8,000 | $3,324 |
| 2023 | $657 | $3,381 | $718 | $2,663 |
| 2021 | $277 | $4,968 | $960 | $4,008 |
| 2020 | $269 | $4,968 | $960 | $4,008 |
| 2019 | $259 | $4,968 | $960 | $4,008 |
| 2018 | $0 | $2,940 | $624 | $2,316 |
| 2017 | $225 | $2,940 | $624 | $2,316 |
| 2016 | -- | $2,940 | $624 | $2,316 |
| 2015 | $223 | $2,940 | $624 | $2,316 |
| 2014 | $201 | $2,940 | $624 | $2,316 |
Source: Public Records
Map
Nearby Homes
- 404 2nd Ave N
- 50 S Kings Hwy Unit Z-50
- 107 S Kings Hwy
- 308 2nd Ave N
- 311 3rd Ave N
- 304 1st Ave N
- 544 Caribbean Way S
- 602 3rd Ave N
- 301 N Ocean Blvd
- 614 Collins St
- 307 Flagg St Unit 105
- 307 Flagg St Unit 205
- 307 Flagg St Unit s 103 104 105 10
- 307 Flagg St Unit 103
- 2310 Seaseeker Ln
- 2308 Seaseeker Ln
- 2312 Seaseeker Ln Unit Lot 11
- 2312 Seaseeker Ln
- 1410 Lancaster Way Unit Lot 198, Ph. 2A, "Ea
- 303 Withers Swash Dr
- 403 2nd Ave N
- 403 2nd Ave N Unit Old Town Village
- 403 2nd Ave N Unit H Old Town Vill
- 403 2nd Ave N Unit G
- 403 2nd Ave N Unit K
- 403 2nd Ave N Unit J
- 403 2nd Ave N Unit 1
- 403 2nd Ave N Unit H
- 403 2nd Ave N Unit F
- 403 2nd Ave N Unit C
- 403 2nd Ave N Unit B
- 403 2nd Ave N Unit A
- 403 2nd Ave N Unit 403-D
- 407 2nd Ave N
- 0 2nd Ave N
- 105 Chester St Unit 2
- 103 & 105 Chester St
- 103 Chester St
- 412 1st Ave S Unit E
- 412 1st Ave S