403 2nd St S Sauk Rapids, MN 56379
Estimated Value: $167,000 - $540,322
2
Beds
1
Bath
837
Sq Ft
$324/Sq Ft
Est. Value
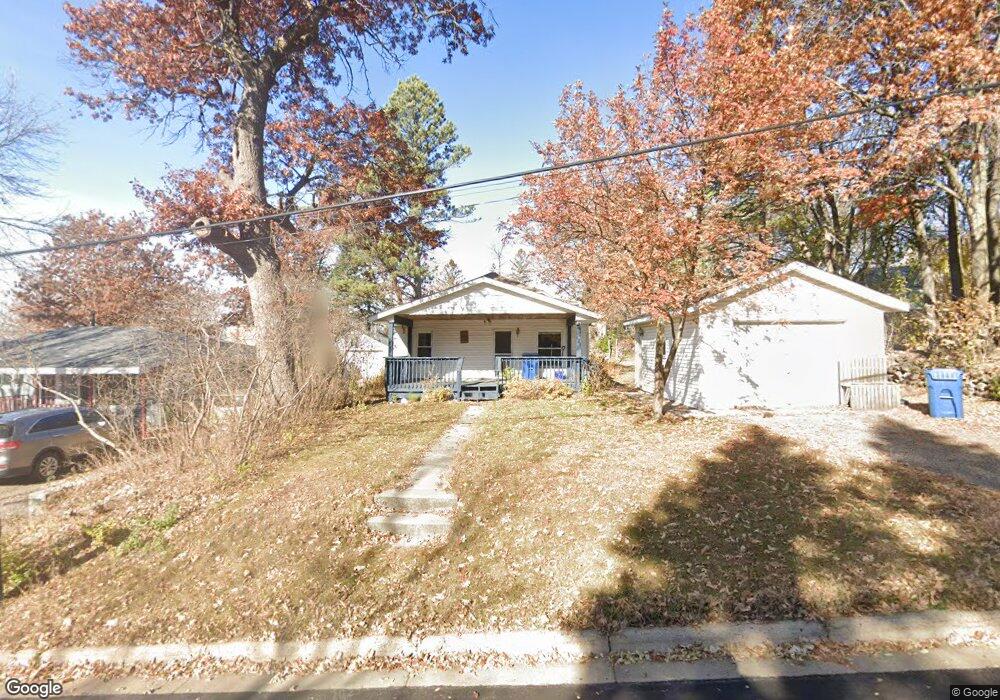
About This Home
This home is located at 403 2nd St S, Sauk Rapids, MN 56379 and is currently estimated at $271,581, approximately $324 per square foot. 403 2nd St S is a home located in Benton County with nearby schools including Mississippi Heights Elementary School, Sauk Rapids-Rice Middle School, and Sauk Rapids-Rice Senior High School.
Ownership History
Date
Name
Owned For
Owner Type
Purchase Details
Closed on
May 16, 2016
Sold by
Tesmer Brian S and Tesmer Kelly
Bought by
Kometz Alisa K
Current Estimated Value
Purchase Details
Closed on
Jul 28, 2006
Sold by
Volt Carrie J and Volt Carrie
Bought by
Tesmer Brian S
Home Financials for this Owner
Home Financials are based on the most recent Mortgage that was taken out on this home.
Original Mortgage
$92,000
Interest Rate
6.82%
Mortgage Type
New Conventional
Create a Home Valuation Report for This Property
The Home Valuation Report is an in-depth analysis detailing your home's value as well as a comparison with similar homes in the area
Home Values in the Area
Average Home Value in this Area
Purchase History
| Date | Buyer | Sale Price | Title Company |
|---|---|---|---|
| Kometz Alisa K | $300,000 | None Available | |
| Tesmer Brian S | $115,000 | -- |
Source: Public Records
Mortgage History
| Date | Status | Borrower | Loan Amount |
|---|---|---|---|
| Previous Owner | Tesmer Brian S | $92,000 |
Source: Public Records
Tax History Compared to Growth
Tax History
| Year | Tax Paid | Tax Assessment Tax Assessment Total Assessment is a certain percentage of the fair market value that is determined by local assessors to be the total taxable value of land and additions on the property. | Land | Improvement |
|---|---|---|---|---|
| 2025 | $1,762 | $143,400 | $27,700 | $115,700 |
| 2024 | $1,802 | $137,500 | $27,700 | $109,800 |
| 2023 | $1,746 | $137,100 | $27,700 | $109,400 |
| 2022 | $1,238 | $121,900 | $25,200 | $96,700 |
| 2021 | $1,128 | $107,600 | $25,200 | $82,400 |
| 2018 | $952 | $63,000 | $16,640 | $46,360 |
| 2017 | $952 | $57,900 | $16,116 | $41,784 |
| 2016 | $928 | $83,500 | $24,300 | $59,200 |
| 2015 | $932 | $49,100 | $15,065 | $34,035 |
| 2014 | -- | $46,000 | $14,631 | $31,369 |
| 2013 | -- | $46,800 | $14,750 | $32,050 |
Source: Public Records
Map
Nearby Homes
- 112 Summit Ave S
- 117 6th Ave N
- 100 9th Ave S
- 608 Summit Ave S
- 216 8th Ave N
- 1804 8th Ave S
- 1803 8th Ave S
- 1021 5th St S
- 615 3rd Ave N
- 1 Skyview Dr
- 2021 Hillcrest Dr
- 1011 Water Ave S
- 3300 321st St
- 3322 321st St
- 1715 Hillcrest Rd
- 224 9th St N
- 2161 Mill Pond Dr
- 1209 Millstone Ct
- 2016 Forest Ct
- 1101 10th Ave N