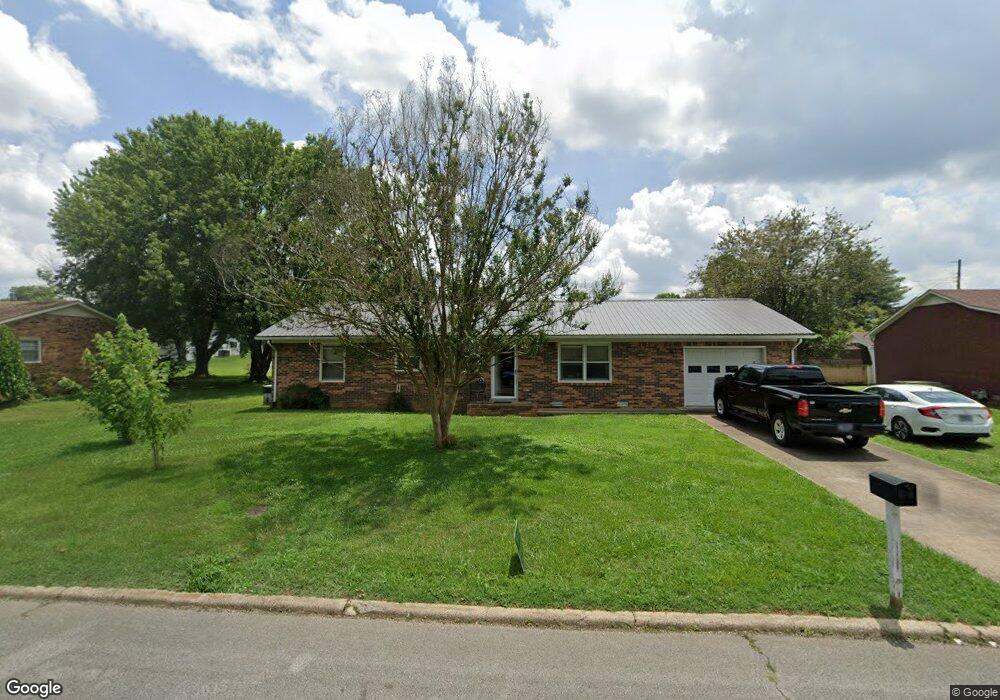
403 8th St Lawrenceburg, TN 38464
Estimated Value: $201,953 - $251,000
--
Bed
2
Baths
1,363
Sq Ft
$166/Sq Ft
Est. Value
About This Home
This home is located at 403 8th St, Lawrenceburg, TN 38464 and is currently estimated at $225,738, approximately $165 per square foot. 403 8th St is a home located in Lawrence County with nearby schools including Ingram Sowell Elementary School, Lawrenceburg Public Elementary School, and David Crockett Elementary School.
Ownership History
Date
Name
Owned For
Owner Type
Purchase Details
Closed on
Aug 30, 2024
Sold by
Keller Oaks Larry
Bought by
Oaks Cecilia Cantina
Current Estimated Value
Purchase Details
Closed on
Jun 25, 2018
Sold by
Oaks Larry Keller
Bought by
Oaks Larry Keller
Purchase Details
Closed on
Oct 7, 2003
Sold by
Martin Bailey George
Bought by
Nell Oaks Bonnie
Purchase Details
Closed on
Aug 27, 1993
Bought by
Bailey Acie L and Bailey Mildred
Create a Home Valuation Report for This Property
The Home Valuation Report is an in-depth analysis detailing your home's value as well as a comparison with similar homes in the area
Home Values in the Area
Average Home Value in this Area
Purchase History
| Date | Buyer | Sale Price | Title Company |
|---|---|---|---|
| Oaks Cecilia Cantina | -- | None Listed On Document | |
| Oaks Larry Keller | -- | None Available | |
| Nell Oaks Bonnie | $76,500 | -- | |
| Bailey Acie L | $5,000 | -- |
Source: Public Records
Tax History Compared to Growth
Tax History
| Year | Tax Paid | Tax Assessment Tax Assessment Total Assessment is a certain percentage of the fair market value that is determined by local assessors to be the total taxable value of land and additions on the property. | Land | Improvement |
|---|---|---|---|---|
| 2025 | $1,366 | $43,950 | $0 | $0 |
| 2024 | $1,366 | $43,950 | $3,750 | $40,200 |
| 2023 | $1,366 | $43,950 | $3,750 | $40,200 |
| 2022 | $1,366 | $43,950 | $3,750 | $40,200 |
| 2021 | $1,100 | $25,025 | $2,500 | $22,525 |
| 2020 | $1,100 | $25,025 | $2,500 | $22,525 |
| 2019 | $1,100 | $25,025 | $2,500 | $22,525 |
| 2018 | $1,100 | $25,025 | $2,500 | $22,525 |
| 2017 | $1,100 | $25,025 | $2,500 | $22,525 |
| 2016 | $1,100 | $25,025 | $2,500 | $22,525 |
| 2015 | $1,042 | $25,025 | $2,500 | $22,525 |
| 2014 | $986 | $23,700 | $2,500 | $21,200 |
Source: Public Records
Map
Nearby Homes