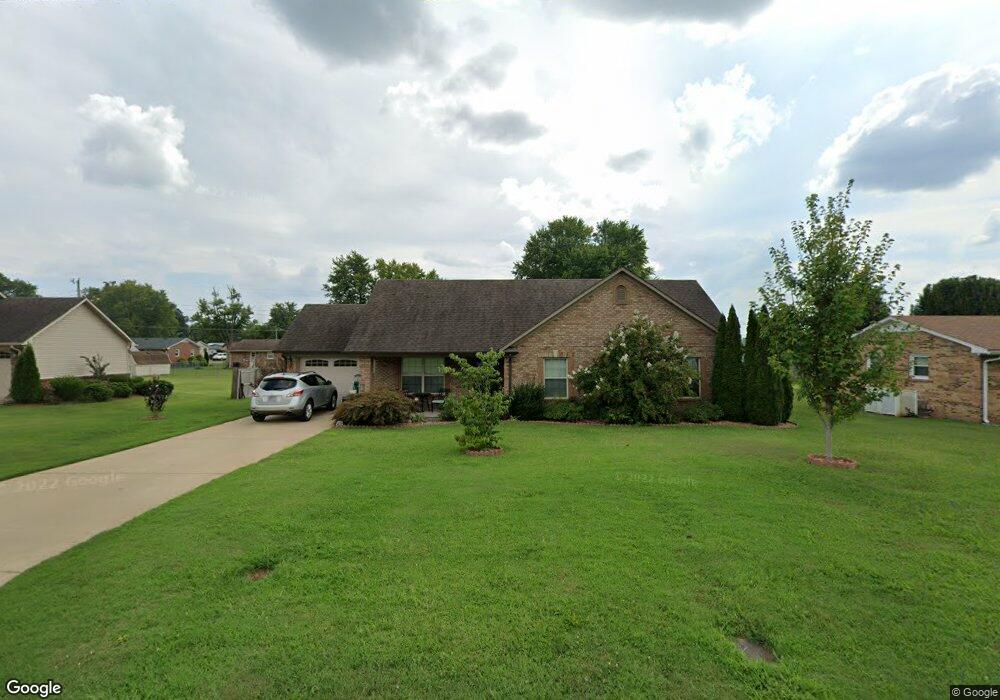
403 9th St Lawrenceburg, TN 38464
Estimated Value: $257,000 - $294,000
3
Beds
2
Baths
1,276
Sq Ft
$210/Sq Ft
Est. Value
About This Home
This home is located at 403 9th St, Lawrenceburg, TN 38464 and is currently estimated at $267,924, approximately $209 per square foot. 403 9th St is a home located in Lawrence County with nearby schools including Ingram Sowell Elementary School, Lawrenceburg Public Elementary School, and David Crockett Elementary School.
Ownership History
Date
Name
Owned For
Owner Type
Purchase Details
Closed on
Jul 22, 2015
Sold by
Allen Joshua
Bought by
Flannery Teri Lynn
Current Estimated Value
Purchase Details
Closed on
Feb 25, 2014
Sold by
Kilpatrick Eunice N
Bought by
Byrd Joshua Matthew
Purchase Details
Closed on
Aug 13, 2007
Sold by
Randy Hill
Bought by
Randy Hill
Purchase Details
Closed on
Aug 5, 1993
Bought by
Shaffer Wiley and Shaffer Margie
Purchase Details
Closed on
Jan 1, 1932
Bought by
Edwards H C
Create a Home Valuation Report for This Property
The Home Valuation Report is an in-depth analysis detailing your home's value as well as a comparison with similar homes in the area
Home Values in the Area
Average Home Value in this Area
Purchase History
| Date | Buyer | Sale Price | Title Company |
|---|---|---|---|
| Flannery Teri Lynn | $127,000 | -- | |
| Byrd Joshua Matthew | $25,000 | -- | |
| Randy Hill | -- | -- | |
| Shaffer Wiley | $5,000 | -- | |
| Edwards H C | -- | -- |
Source: Public Records
Tax History Compared to Growth
Tax History
| Year | Tax Paid | Tax Assessment Tax Assessment Total Assessment is a certain percentage of the fair market value that is determined by local assessors to be the total taxable value of land and additions on the property. | Land | Improvement |
|---|---|---|---|---|
| 2025 | $1,502 | $48,325 | $0 | $0 |
| 2024 | $1,502 | $48,325 | $5,000 | $43,325 |
| 2023 | $1,502 | $48,325 | $5,000 | $43,325 |
| 2022 | $1,502 | $48,325 | $5,000 | $43,325 |
| 2021 | $1,349 | $30,700 | $3,750 | $26,950 |
| 2020 | $1,349 | $30,700 | $3,750 | $26,950 |
| 2019 | $1,349 | $30,700 | $3,750 | $26,950 |
| 2018 | $1,349 | $30,700 | $3,750 | $26,950 |
| 2017 | $1,349 | $30,700 | $3,750 | $26,950 |
| 2016 | $1,349 | $30,700 | $3,750 | $26,950 |
| 2015 | $1,278 | $30,700 | $3,750 | $26,950 |
| 2014 | $104 | $2,500 | $2,500 | $0 |
Source: Public Records
Map
Nearby Homes