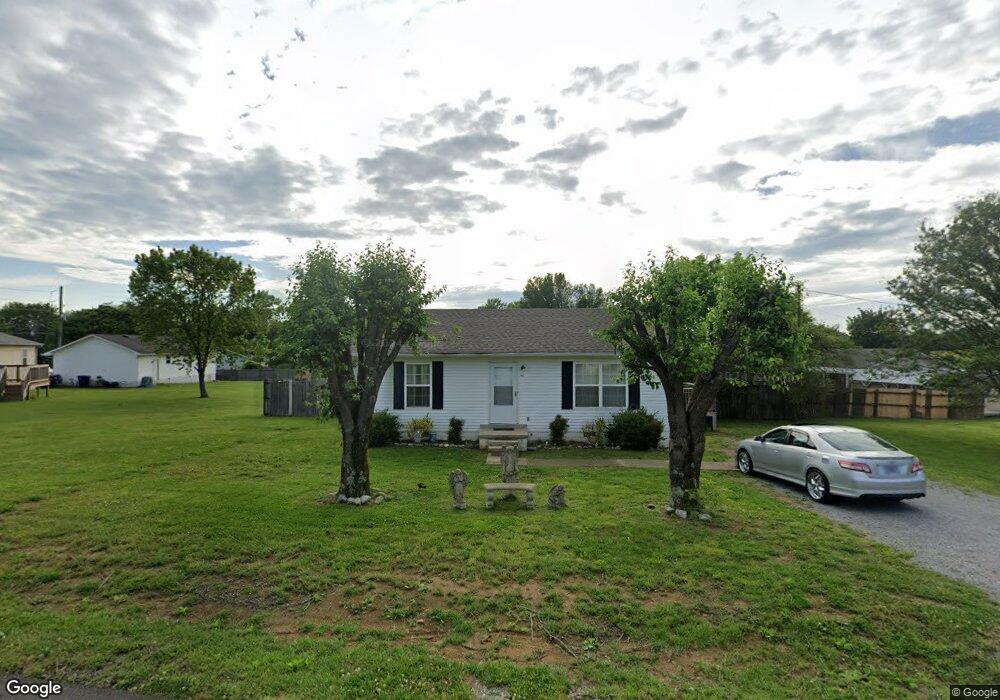
403 Cherokee Trail Shelbyville, TN 37160
Estimated Value: $152,000 - $223,000
--
Bed
1
Bath
864
Sq Ft
$207/Sq Ft
Est. Value
About This Home
This home is located at 403 Cherokee Trail, Shelbyville, TN 37160 and is currently estimated at $179,060, approximately $207 per square foot. 403 Cherokee Trail is a home located in Bedford County with nearby schools including Harris Middle School and Victory Baptist Academy.
Ownership History
Date
Name
Owned For
Owner Type
Purchase Details
Closed on
May 26, 2011
Sold by
Serena Connie J
Bought by
Clanton Jerry
Current Estimated Value
Purchase Details
Closed on
Feb 3, 2011
Sold by
Cahall Jack E
Bought by
Serena Connie J
Purchase Details
Closed on
Mar 30, 2009
Sold by
Flippo Steven Ray
Bought by
Cahall Jack E
Purchase Details
Closed on
Jan 21, 2009
Sold by
Secretary Of Housing
Bought by
Flippo Steven Ray
Purchase Details
Closed on
Jun 13, 2008
Sold by
Zamora Juan J
Bought by
Secretary Of Housing
Purchase Details
Closed on
Jun 12, 2001
Bought by
Zamora Juan J
Purchase Details
Closed on
Sep 16, 1997
Sold by
Warren James R Et Ux Joann
Bought by
Wilhoite James H and Wilhoite Anna J
Purchase Details
Closed on
May 17, 1996
Sold by
Shapard Scott S
Bought by
Brannon David
Create a Home Valuation Report for This Property
The Home Valuation Report is an in-depth analysis detailing your home's value as well as a comparison with similar homes in the area
Home Values in the Area
Average Home Value in this Area
Purchase History
| Date | Buyer | Sale Price | Title Company |
|---|---|---|---|
| Clanton Jerry | $48,500 | -- | |
| Serena Connie J | $59,000 | -- | |
| Cahall Jack E | $59,000 | -- | |
| Flippo Steven Ray | $38,250 | -- | |
| Secretary Of Housing | $73,976 | -- | |
| Zamora Juan J | $70,000 | -- | |
| Wilhoite James H | $20,000 | -- | |
| Brannon David | $6,000 | -- |
Source: Public Records
Tax History Compared to Growth
Tax History
| Year | Tax Paid | Tax Assessment Tax Assessment Total Assessment is a certain percentage of the fair market value that is determined by local assessors to be the total taxable value of land and additions on the property. | Land | Improvement |
|---|---|---|---|---|
| 2025 | -- | $21,025 | $0 | $0 |
| 2024 | -- | $21,025 | $4,725 | $16,300 |
| 2023 | $311 | $21,025 | $4,725 | $16,300 |
| 2022 | $823 | $21,025 | $4,725 | $16,300 |
| 2021 | $747 | $21,025 | $4,725 | $16,300 |
| 2020 | $629 | $21,025 | $4,725 | $16,300 |
| 2019 | $629 | $14,200 | $2,250 | $11,950 |
| 2018 | $615 | $14,200 | $2,250 | $11,950 |
| 2017 | $615 | $14,200 | $2,250 | $11,950 |
| 2016 | $609 | $14,200 | $2,250 | $11,950 |
| 2015 | $609 | $14,200 | $2,250 | $11,950 |
| 2014 | $525 | $13,382 | $0 | $0 |
Source: Public Records
Map
Nearby Homes
- 807 Shoma Dr
- 108 Virginia Ct
- 11 Amos Smith Rd
- 106 Ledgeview Dr
- 967 Horse Mountain Rd Unit 1E
- 967 Horse Mountain Rd Unit 3-G
- 1747 Park Place Plan at Park Place
- 967 Horse Mountain Rd
- 1420 Park Place Plan at Park Place
- 1499 Park Place Plan at Park Place
- 1628 Park Place Plan at Park Place
- 1690 Park Place Plan at Park Place
- 967 Horse Mountain Rd Unit 6G
- 967 Horse Mountain Rd Unit 2F
- 104 Curbow Ct
- 216 Idle Dr
- 217 Idle Dr
- 227 Idle Dr
- 229 Idle Dr
- 221 Idle Dr
- 401 Cherokee Trail
- 1056 Horse Mountain Rd
- 1060 Horse Mountain Rd
- 809 Shoma Dr
- 402 Cherokee Trail
- 400 Cherokee Trail
- 1050 Horse Mountain Rd
- 1100 Horse Mountain Rd
- 312 Cherokee Trail
- 311 Cherokee Trail
- 1046 Horse Mountain Rd
- 310 Cherokee Trail
- 808 Shoma Dr
- 803 Shoma Dr
- 309 Cherokee Trail
- 1110 Horse Mountain Rd
- 1110 Horse Mountain Rd
- 800 Shoma Dr
- 308 Cherokee Trail
- 801 Shoma Dr