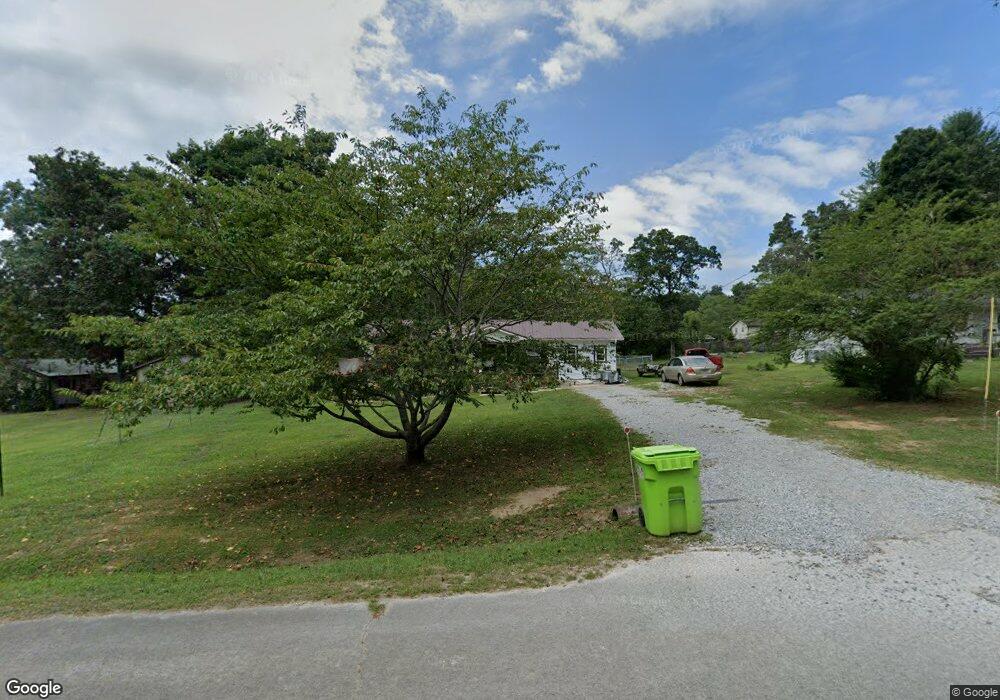
403 Dillon St Crossville, TN 38555
Estimated Value: $219,067 - $257,000
4
Beds
3
Baths
1,500
Sq Ft
$161/Sq Ft
Est. Value
About This Home
This home is located at 403 Dillon St, Crossville, TN 38555 and is currently estimated at $242,017, approximately $161 per square foot. 403 Dillon St is a home located in Cumberland County with nearby schools including Pleasant Hill Elementary School, Cumberland County High School, and Christian Academy of the Cumberlands.
Ownership History
Date
Name
Owned For
Owner Type
Purchase Details
Closed on
Feb 27, 2009
Sold by
Salisbury John
Bought by
Lester Marty O
Current Estimated Value
Home Financials for this Owner
Home Financials are based on the most recent Mortgage that was taken out on this home.
Original Mortgage
$95,778
Outstanding Balance
$60,147
Interest Rate
5.14%
Estimated Equity
$181,870
Purchase Details
Closed on
Oct 30, 2008
Sold by
Peters Gary W
Bought by
Salisbury John
Purchase Details
Closed on
Nov 5, 2004
Sold by
Dole Ronald T
Bought by
Peters Gary W
Home Financials for this Owner
Home Financials are based on the most recent Mortgage that was taken out on this home.
Original Mortgage
$67,000
Interest Rate
5.77%
Purchase Details
Closed on
Nov 4, 2004
Bought by
Peters Gary W
Home Financials for this Owner
Home Financials are based on the most recent Mortgage that was taken out on this home.
Original Mortgage
$67,000
Interest Rate
5.77%
Purchase Details
Closed on
May 15, 1991
Bought by
Dole Ronald T % Natl Mortg Co
Create a Home Valuation Report for This Property
The Home Valuation Report is an in-depth analysis detailing your home's value as well as a comparison with similar homes in the area
Home Values in the Area
Average Home Value in this Area
Purchase History
| Date | Buyer | Sale Price | Title Company |
|---|---|---|---|
| Lester Marty O | $93,900 | -- | |
| Salisbury John | $56,951 | -- | |
| Peters Gary W | $67,000 | -- | |
| Peters Gary W | $67,000 | -- | |
| Dole Ronald T % Natl Mortg Co | $52,000 | -- |
Source: Public Records
Mortgage History
| Date | Status | Borrower | Loan Amount |
|---|---|---|---|
| Open | Dole Ronald T % Natl Mortg Co | $95,778 | |
| Previous Owner | Dole Ronald T % Natl Mortg Co | $67,000 | |
| Previous Owner | Dole Ronald T % Natl Mortg Co | $67,000 |
Source: Public Records
Tax History Compared to Growth
Tax History
| Year | Tax Paid | Tax Assessment Tax Assessment Total Assessment is a certain percentage of the fair market value that is determined by local assessors to be the total taxable value of land and additions on the property. | Land | Improvement |
|---|---|---|---|---|
| 2025 | $388 | $34,150 | $2,250 | $31,900 |
| 2024 | $388 | $34,150 | $2,250 | $31,900 |
| 2023 | $388 | $34,150 | $0 | $0 |
| 2022 | $388 | $34,150 | $2,250 | $31,900 |
| 2021 | $273 | $17,425 | $2,250 | $15,175 |
| 2020 | $273 | $17,425 | $2,250 | $15,175 |
| 2019 | $273 | $17,425 | $2,250 | $15,175 |
| 2018 | $273 | $17,425 | $2,250 | $15,175 |
| 2017 | $273 | $17,425 | $2,250 | $15,175 |
| 2016 | $280 | $18,350 | $2,250 | $16,100 |
| 2015 | $275 | $18,350 | $2,250 | $16,100 |
| 2014 | $275 | $18,354 | $0 | $0 |
Source: Public Records
Map
Nearby Homes
- 275 Hawthorn Loop
- 36 White Oak Cir
- 171 Red Oak Dr
- 41 Hawthorn Cir
- 229 Hawthorn Loop
- 27 Hickory Hollow Cir
- 172 Hawthorn Loop
- 122 Lee Cir
- 150 Dillon St
- 78 Our Way Loop
- 1378 Sparta Hwy Unit 1378
- 0 Red Oak Dr Unit 1255165
- 0 Red Oak Dr Unit 1306752
- 88 acres Sparta Hwy
- 0 Holly Tree Dr Unit 1289825
- 1177 Sparta Hwy
- 214 Woodhaven Dr
- 0.72 ac Waterview Dr
- 0 Waterview Dr Unit 1306982
- 0 Dr