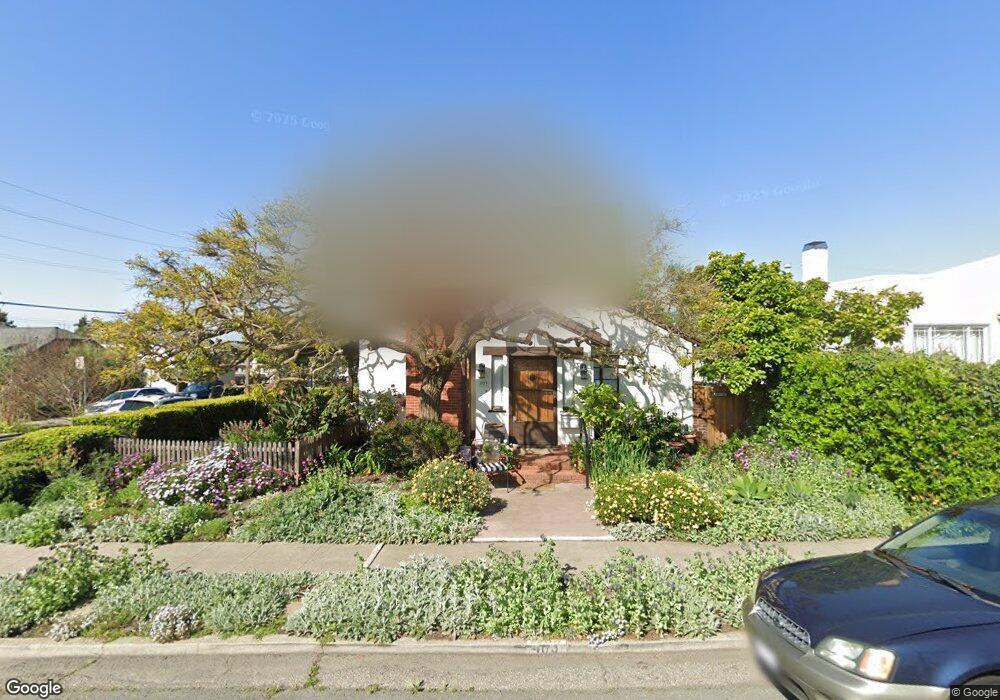
403 Dimm St Richmond, CA 94805
East Richmond NeighborhoodEstimated Value: $827,000 - $1,034,000
3
Beds
2
Baths
1,519
Sq Ft
$601/Sq Ft
Est. Value
About This Home
This home is located at 403 Dimm St, Richmond, CA 94805 and is currently estimated at $912,765, approximately $600 per square foot. 403 Dimm St is a home located in Contra Costa County with nearby schools including Mira Vista Elementary School, Fred T. Korematsu Middle School, and El Cerrito Senior High School.
Ownership History
Date
Name
Owned For
Owner Type
Purchase Details
Closed on
Jan 28, 2013
Sold by
Marinos Stacy L
Bought by
Nishimoto George K
Current Estimated Value
Purchase Details
Closed on
Oct 5, 2005
Sold by
Smeltzer David F and Smart Susanna J
Bought by
Marinos Stacy L
Home Financials for this Owner
Home Financials are based on the most recent Mortgage that was taken out on this home.
Original Mortgage
$430,000
Interest Rate
5.63%
Mortgage Type
Fannie Mae Freddie Mac
Create a Home Valuation Report for This Property
The Home Valuation Report is an in-depth analysis detailing your home's value as well as a comparison with similar homes in the area
Home Values in the Area
Average Home Value in this Area
Purchase History
| Date | Buyer | Sale Price | Title Company |
|---|---|---|---|
| Nishimoto George K | $460,000 | North American Title | |
| Marinos Stacy L | $671,000 | Old Republic Title |
Source: Public Records
Mortgage History
| Date | Status | Borrower | Loan Amount |
|---|---|---|---|
| Previous Owner | Marinos Stacy L | $430,000 |
Source: Public Records
Tax History
| Year | Tax Paid | Tax Assessment Tax Assessment Total Assessment is a certain percentage of the fair market value that is determined by local assessors to be the total taxable value of land and additions on the property. | Land | Improvement |
|---|---|---|---|---|
| 2025 | $9,593 | $566,446 | $307,852 | $258,594 |
| 2024 | $9,257 | $555,340 | $301,816 | $253,524 |
| 2023 | $9,257 | $544,452 | $295,899 | $248,553 |
| 2022 | $9,098 | $533,778 | $290,098 | $243,680 |
| 2021 | $9,021 | $523,312 | $284,410 | $238,902 |
| 2019 | $8,485 | $507,792 | $275,975 | $231,817 |
| 2018 | $8,193 | $497,836 | $270,564 | $227,272 |
| 2017 | $8,016 | $488,075 | $265,259 | $222,816 |
| 2016 | $7,926 | $478,506 | $260,058 | $218,448 |
| 2015 | $7,899 | $471,319 | $256,152 | $215,167 |
| 2014 | $7,811 | $462,088 | $251,135 | $210,953 |
Source: Public Records
Map
Nearby Homes
Your Personal Tour Guide
Ask me questions while you tour the home.