Estimated Value: $553,000 - $574,000
Studio
3
Baths
3,087
Sq Ft
$183/Sq Ft
Est. Value
About This Home
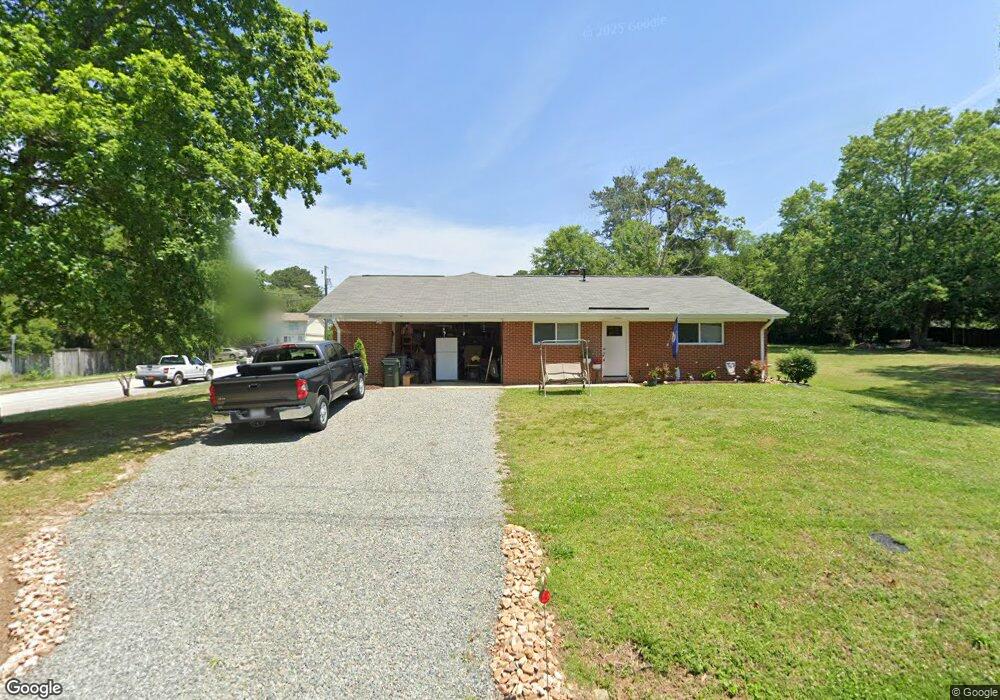
This home is located at 403 E Chatham St, Apex, NC 27502 and is currently estimated at $563,500, approximately $182 per square foot. 403 E Chatham St is a home located in Wake County with nearby schools including Apex Elementary School, Apex Middle, and Apex High School.
Ownership History
Date
Name
Owned For
Owner Type
Purchase Details
Closed on
Aug 17, 2018
Sold by
Roth Gray M and Roth Thomas J
Bought by
Campbell Nortyh Llc
Current Estimated Value
Purchase Details
Closed on
Apr 9, 2015
Sold by
Lund Marcia M and Lund Adrian
Bought by
Roth Gray M
Purchase Details
Closed on
Dec 31, 2011
Sold by
Roth Gray M and Lund Marcia M
Bought by
Roth Gray M and Lund Marcia M
Purchase Details
Closed on
Jan 1, 2004
Sold by
Woodrow W Maynard Trust
Bought by
Woodrow W Maynard Marital Trust
Purchase Details
Closed on
Jun 7, 1999
Sold by
Maynard Annie Ruth C
Bought by
Maynard Woodrow W
Create a Home Valuation Report for This Property
The Home Valuation Report is an in-depth analysis detailing your home's value as well as a comparison with similar homes in the area
Purchase History
| Date | Buyer | Sale Price | Title Company |
|---|---|---|---|
| Campbell Nortyh Llc | -- | None Available | |
| Roth Gray M | -- | None Available | |
| Roth Gray M | -- | None Available | |
| Woodrow W Maynard Marital Trust | -- | -- | |
| Maynard Woodrow W | -- | -- |
Source: Public Records
Tax History
| Year | Tax Paid | Tax Assessment Tax Assessment Total Assessment is a certain percentage of the fair market value that is determined by local assessors to be the total taxable value of land and additions on the property. | Land | Improvement |
|---|---|---|---|---|
| 2025 | $4,946 | $559,561 | $230,000 | $329,561 |
| 2024 | $4,836 | $559,561 | $230,000 | $329,561 |
Source: Public Records
Map
Nearby Homes
- 105 Cunningham St
- 107 N Ellington St
- 311 Culvert St
- 309 Culvert St
- 307 S Elm St
- 102 Briarcliff St
- 314 Wrenn St
- 327 Old Mill Village Dr
- 635 Sawcut Ln
- 631 Sawcut Ln
- 633 Sawcut Ln
- 909 Bryn Mawr Ct
- 300 Pate St
- 406 S Salem St
- 547 Grand Central Station
- 596 Grand Central Station
- 206 Hinton St
- 345 Great Northern Station
- 506 W Chatham St
- 295 Williams Grove Ln Unit Lot 67
- 108 N Mason St
- 319 E Chatham St
- 409 E Chatham St
- 406 E Chatham St
- 408 E Chatham St
- 411 E Chatham St
- 114 N Mason St
- 404 E Chatham St
- 404 Culvert St
- 316 Culvert St
- 317 E Chatham St
- 410 E Chatham St
- 408 Culvert St
- 415 E Chatham St
- 107 S Mason St
- 107 S Mason St Unit C
- 107 S Mason St Unit B
- 107 S Mason St Unit A
- 314 E Chatham St
- 104 S Mason St
Your Personal Tour Guide
Ask me questions while you tour the home.