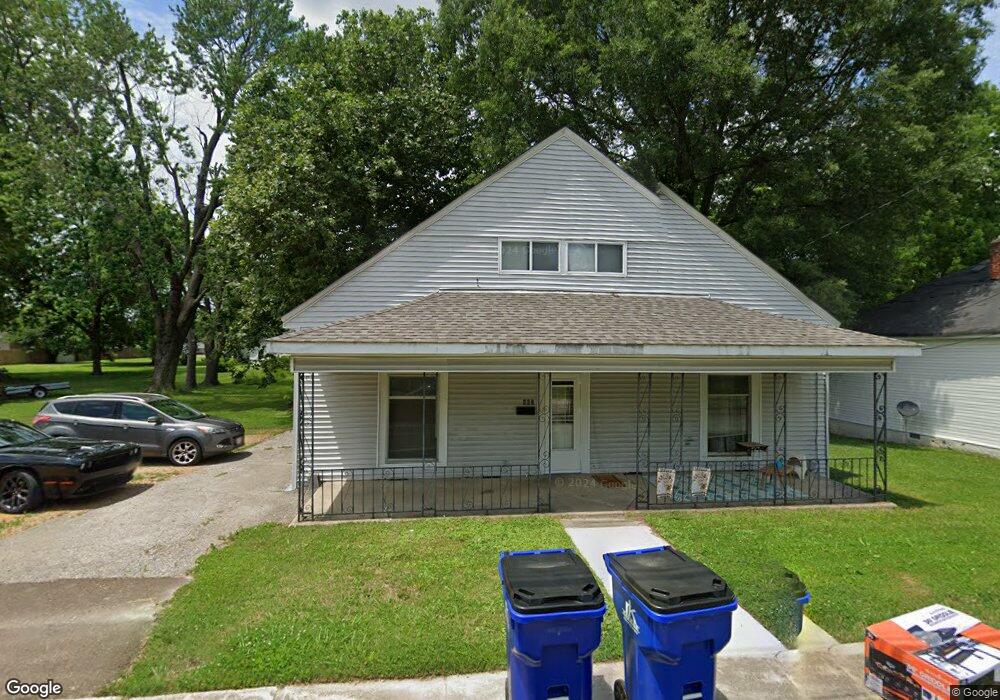
403 Elm St Martin, TN 38237
Estimated Value: $105,136 - $170,000
--
Bed
1
Bath
1,200
Sq Ft
$110/Sq Ft
Est. Value
About This Home
This home is located at 403 Elm St, Martin, TN 38237 and is currently estimated at $132,034, approximately $110 per square foot. 403 Elm St is a home located in Weakley County with nearby schools including Central Christian Academy and Unity Christian School.
Ownership History
Date
Name
Owned For
Owner Type
Purchase Details
Closed on
Jan 29, 2025
Sold by
Winstead Mark H and Winstead Dawn M
Bought by
Legacy Residential Investment Trust and Winstead
Current Estimated Value
Purchase Details
Closed on
May 31, 2013
Sold by
Freeman Charles L
Bought by
Winstead Mark and Winstead Dawn
Purchase Details
Closed on
Jun 30, 2004
Sold by
Provident Bank
Bought by
Freeman Charles L
Purchase Details
Closed on
Aug 26, 2003
Sold by
Stout John W Etux & Truste
Bought by
Provident Bank
Purchase Details
Closed on
Aug 6, 1991
Bought by
Stout John W and Stout Phyllis M
Purchase Details
Closed on
Mar 27, 1991
Bought by
Jackson Amy Lynn
Create a Home Valuation Report for This Property
The Home Valuation Report is an in-depth analysis detailing your home's value as well as a comparison with similar homes in the area
Home Values in the Area
Average Home Value in this Area
Purchase History
| Date | Buyer | Sale Price | Title Company |
|---|---|---|---|
| Legacy Residential Investment Trust | -- | None Listed On Document | |
| Legacy Residential Investment Trust | -- | None Listed On Document | |
| Winstead Mark | $93,500 | -- | |
| Freeman Charles L | $25,000 | -- | |
| Provident Bank | $19,900 | -- | |
| Stout John W | $24,000 | -- | |
| Jackson Amy Lynn | $15,000 | -- |
Source: Public Records
Tax History Compared to Growth
Tax History
| Year | Tax Paid | Tax Assessment Tax Assessment Total Assessment is a certain percentage of the fair market value that is determined by local assessors to be the total taxable value of land and additions on the property. | Land | Improvement |
|---|---|---|---|---|
| 2024 | -- | $19,550 | $2,500 | $17,050 |
| 2023 | $596 | $19,750 | $2,500 | $17,250 |
| 2022 | $484 | $13,000 | $1,500 | $11,500 |
| 2021 | $484 | $13,000 | $1,500 | $11,500 |
| 2020 | $484 | $13,000 | $1,500 | $11,500 |
| 2019 | $439 | $13,000 | $1,500 | $11,500 |
| 2018 | $500 | $14,825 | $1,500 | $13,325 |
| 2017 | $440 | $12,100 | $1,250 | $10,850 |
| 2016 | $440 | $12,100 | $0 | $0 |
| 2015 | $439 | $12,091 | $0 | $0 |
| 2014 | $439 | $12,091 | $0 | $0 |
Source: Public Records
Map
Nearby Homes