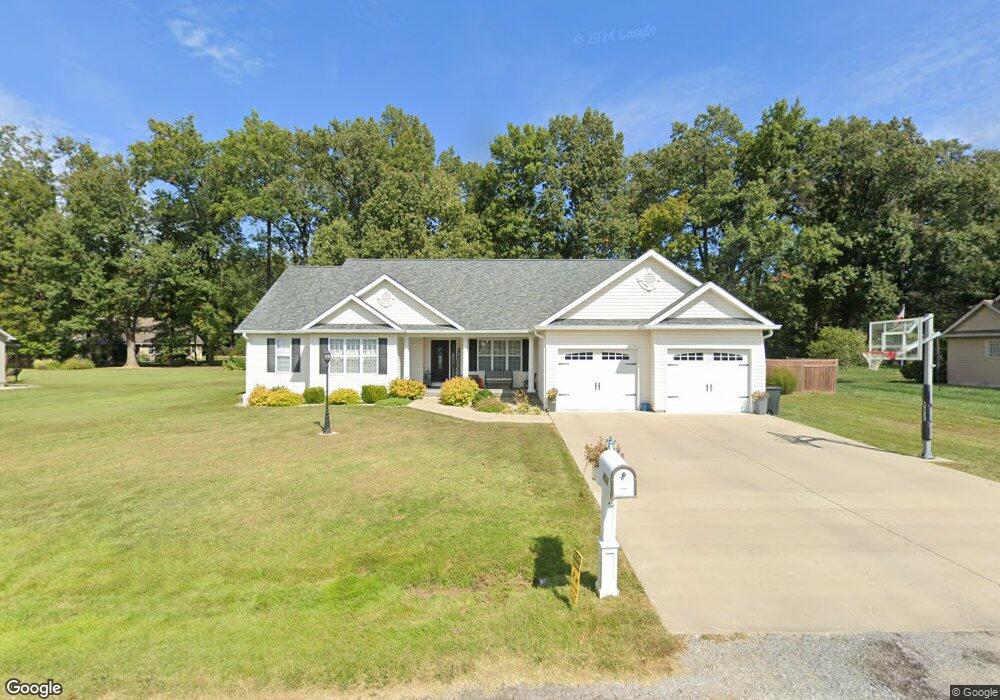
403 Eric Dr Unit 5 Herrin, IL 62948
Estimated Value: $273,000 - $334,278
4
Beds
3
Baths
2,010
Sq Ft
$150/Sq Ft
Est. Value
About This Home
This home is located at 403 Eric Dr Unit 5, Herrin, IL 62948 and is currently estimated at $301,070, approximately $149 per square foot. 403 Eric Dr Unit 5 is a home located in Williamson County with nearby schools including North Side Primary Center, Herrin Community Elementary School, and Herrin Middle School.
Ownership History
Date
Name
Owned For
Owner Type
Purchase Details
Closed on
Jul 25, 2017
Sold by
Nathan Simpkins
Bought by
Cowan Erica N and Cowan Christopher M
Current Estimated Value
Home Financials for this Owner
Home Financials are based on the most recent Mortgage that was taken out on this home.
Original Mortgage
$173,700
Outstanding Balance
$143,260
Interest Rate
3.89%
Mortgage Type
New Conventional
Estimated Equity
$157,810
Create a Home Valuation Report for This Property
The Home Valuation Report is an in-depth analysis detailing your home's value as well as a comparison with similar homes in the area
Home Values in the Area
Average Home Value in this Area
Purchase History
| Date | Buyer | Sale Price | Title Company |
|---|---|---|---|
| Cowan Erica N | $193,000 | Green Stephen R |
Source: Public Records
Mortgage History
| Date | Status | Borrower | Loan Amount |
|---|---|---|---|
| Open | Cowan Erica N | $173,700 |
Source: Public Records
Tax History
| Year | Tax Paid | Tax Assessment Tax Assessment Total Assessment is a certain percentage of the fair market value that is determined by local assessors to be the total taxable value of land and additions on the property. | Land | Improvement |
|---|---|---|---|---|
| 2025 | $7,293 | $89,690 | $11,670 | $78,020 |
| 2024 | $7,481 | $89,690 | $11,670 | $78,020 |
| 2023 | $7,293 | $89,690 | $11,670 | $78,020 |
| 2022 | $6,226 | $79,020 | $10,280 | $68,740 |
| 2021 | $6,040 | $76,170 | $9,910 | $66,260 |
| 2020 | $6,040 | $71,960 | $9,360 | $62,600 |
| 2019 | $5,605 | $71,960 | $9,360 | $62,600 |
| 2018 | $5,605 | $71,960 | $9,360 | $62,600 |
| 2017 | $5,977 | $71,960 | $9,360 | $62,600 |
| 2015 | $5,715 | $68,170 | $8,870 | $59,300 |
| 2013 | $34 | $68,170 | $8,870 | $59,300 |
| 2012 | $34 | $48,400 | $8,870 | $39,530 |
Source: Public Records
Map
Nearby Homes
Your Personal Tour Guide
Ask me questions while you tour the home.