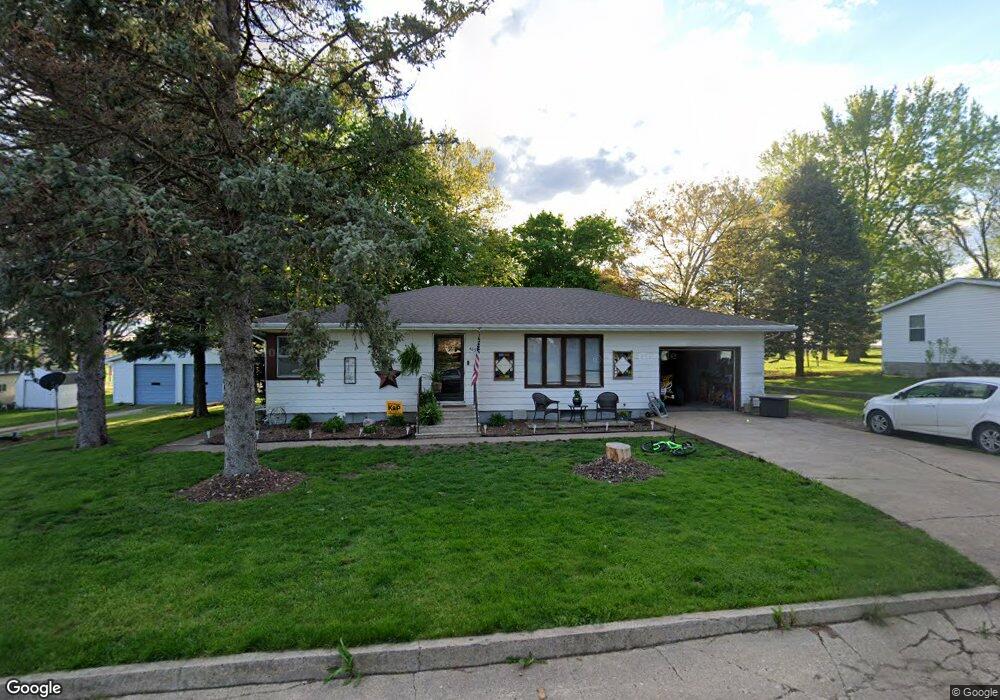
403 Hillcrest Ave Pierson, IA 51048
Estimated Value: $90,000 - $131,178
2
Beds
2
Baths
1,216
Sq Ft
$93/Sq Ft
Est. Value
About This Home
This home is located at 403 Hillcrest Ave, Pierson, IA 51048 and is currently estimated at $112,545, approximately $92 per square foot. 403 Hillcrest Ave is a home located in Woodbury County with nearby schools including Pierson Elementary School, Pierson Middle School, and Kingsley-Pierson High School.
Ownership History
Date
Name
Owned For
Owner Type
Purchase Details
Closed on
Aug 11, 2021
Sold by
City Of Pierson
Bought by
Hill Alesha J
Current Estimated Value
Purchase Details
Closed on
Sep 12, 2019
Sold by
Farley-Wamberg Nicholas I
Bought by
Hill Aleshya J
Purchase Details
Closed on
Jan 4, 2016
Sold by
Bracht Alesha and Farley Wamberg Nicholas I
Bought by
Wamberg Alesha J and Farley Wamberg Nicholas I
Purchase Details
Closed on
Feb 7, 2008
Sold by
White Beverly
Bought by
Bracht Alesha
Home Financials for this Owner
Home Financials are based on the most recent Mortgage that was taken out on this home.
Original Mortgage
$69,760
Interest Rate
5.9%
Mortgage Type
New Conventional
Create a Home Valuation Report for This Property
The Home Valuation Report is an in-depth analysis detailing your home's value as well as a comparison with similar homes in the area
Home Values in the Area
Average Home Value in this Area
Purchase History
| Date | Buyer | Sale Price | Title Company |
|---|---|---|---|
| Hill Alesha J | -- | None Available | |
| Hill Aleshya J | -- | -- | |
| Wamberg Alesha J | -- | None Available | |
| Bracht Alesha | $168,180 | -- |
Source: Public Records
Mortgage History
| Date | Status | Borrower | Loan Amount |
|---|---|---|---|
| Previous Owner | Bracht Alesha | $69,760 |
Source: Public Records
Tax History Compared to Growth
Tax History
| Year | Tax Paid | Tax Assessment Tax Assessment Total Assessment is a certain percentage of the fair market value that is determined by local assessors to be the total taxable value of land and additions on the property. | Land | Improvement |
|---|---|---|---|---|
| 2025 | $1,662 | $80,470 | $5,250 | $75,220 |
| 2024 | $1,662 | $93,010 | $5,250 | $87,760 |
| 2023 | $1,516 | $93,010 | $5,250 | $87,760 |
| 2022 | $1,492 | $71,680 | $5,250 | $66,430 |
| 2021 | $1,492 | $71,680 | $5,250 | $66,430 |
| 2020 | $1,478 | $69,080 | $5,620 | $63,460 |
| 2019 | $1,426 | $69,080 | $5,620 | $63,460 |
| 2018 | $1,470 | $64,560 | $5,620 | $58,940 |
| 2017 | $1,502 | $64,560 | $5,620 | $58,940 |
| 2016 | $1,484 | $64,560 | $0 | $0 |
| 2015 | $1,404 | $60,330 | $5,250 | $55,080 |
| 2014 | $1,404 | $60,330 | $5,250 | $55,080 |
Source: Public Records
Map
Nearby Homes