Estimated Value: $91,000 - $214,959
4
Beds
2
Baths
1,958
Sq Ft
$90/Sq Ft
Est. Value
About This Home
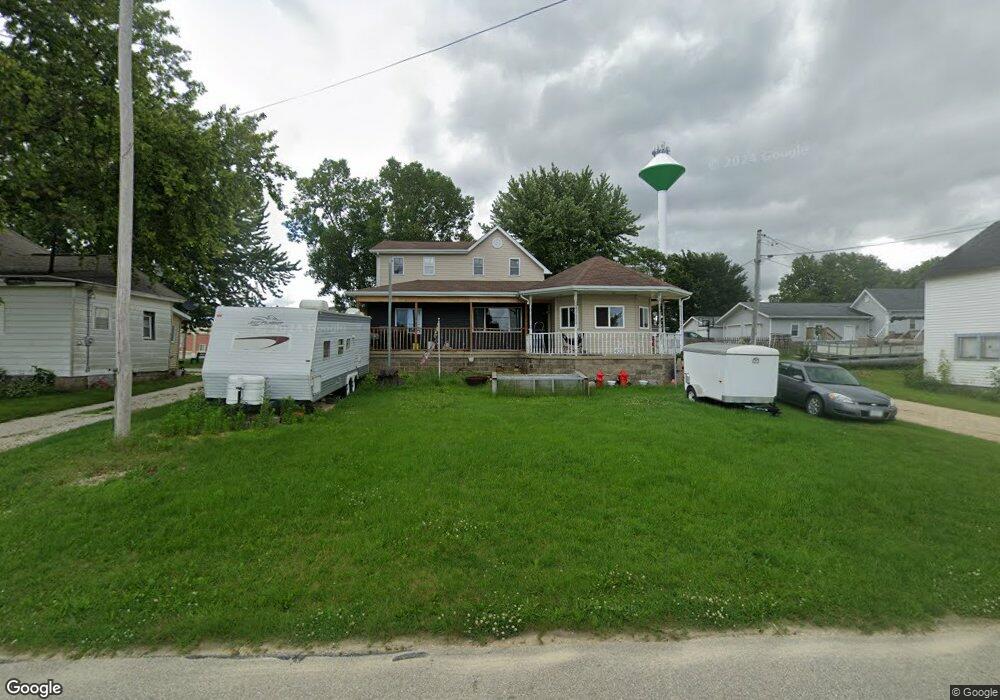
This home is located at 403 Howard St, Ryan, IA 52330 and is currently estimated at $176,740, approximately $90 per square foot. 403 Howard St is a home located in Delaware County with nearby schools including Lambert Elementary School, West Delaware Middle School, and West Delaware High School.
Ownership History
Date
Name
Owned For
Owner Type
Purchase Details
Closed on
Apr 8, 2008
Sold by
Mittan Richard L and Mittan Richard
Bought by
Deutsche Bank National Trust Co
Current Estimated Value
Purchase Details
Closed on
Jan 12, 2006
Sold by
Mcintyre Andrew and Mcintyre Jennifer
Bought by
Mittan Richard and Mittan Melanie
Home Financials for this Owner
Home Financials are based on the most recent Mortgage that was taken out on this home.
Original Mortgage
$104,400
Interest Rate
6.46%
Mortgage Type
New Conventional
Create a Home Valuation Report for This Property
The Home Valuation Report is an in-depth analysis detailing your home's value as well as a comparison with similar homes in the area
Purchase History
| Date | Buyer | Sale Price | Title Company |
|---|---|---|---|
| Deutsche Bank National Trust Co | $120,135 | -- | |
| Mittan Richard | $138,666 | -- |
Source: Public Records
Mortgage History
| Date | Status | Borrower | Loan Amount |
|---|---|---|---|
| Previous Owner | Mittan Richard | $104,400 |
Source: Public Records
Tax History
| Year | Tax Paid | Tax Assessment Tax Assessment Total Assessment is a certain percentage of the fair market value that is determined by local assessors to be the total taxable value of land and additions on the property. | Land | Improvement |
|---|---|---|---|---|
| 2025 | $3,308 | $205,300 | $7,600 | $197,700 |
| 2024 | $3,308 | $195,700 | $7,600 | $188,100 |
| 2023 | $2,924 | $195,700 | $7,600 | $188,100 |
| 2022 | $2,788 | $155,600 | $6,100 | $149,500 |
| 2021 | $2,860 | $155,600 | $6,100 | $149,500 |
| 2020 | $2,860 | $151,100 | $9,200 | $141,900 |
| 2019 | $2,512 | $134,300 | $0 | $0 |
| 2018 | $2,468 | $134,300 | $0 | $0 |
| 2017 | $2,468 | $119,600 | $0 | $0 |
| 2016 | $2,148 | $119,600 | $0 | $0 |
| 2015 | $2,322 | $125,800 | $0 | $0 |
| 2014 | $2,322 | $125,800 | $0 | $0 |
Source: Public Records
Map
Nearby Homes
Your Personal Tour Guide
Ask me questions while you tour the home.