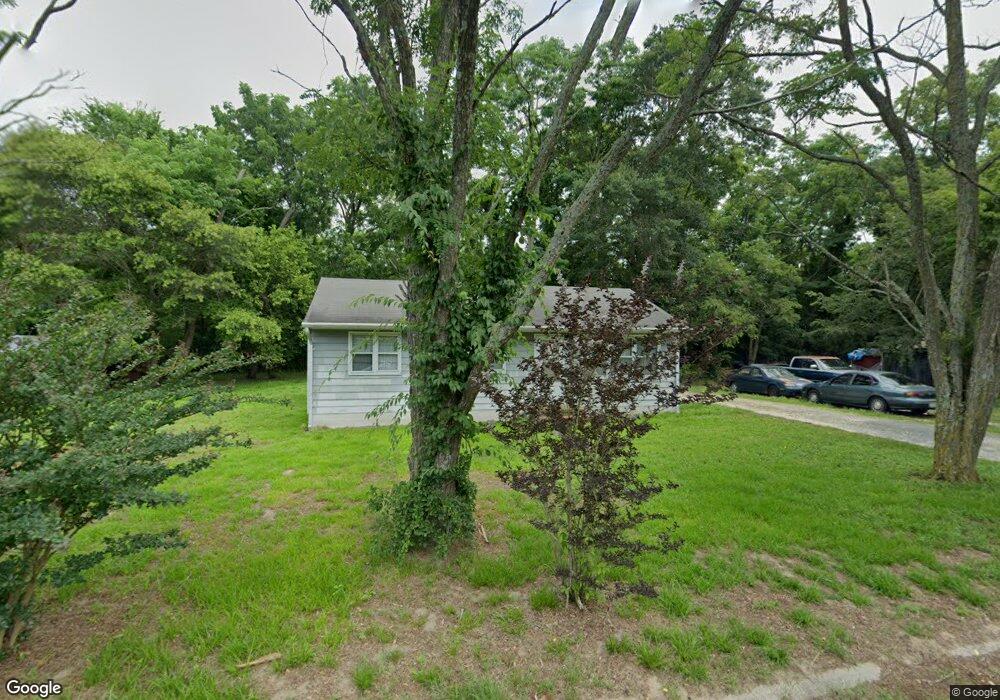
403 James Ln Salisbury, MD 21801
North Salisbury NeighborhoodEstimated Value: $168,380 - $223,000
Studio
1
Bath
960
Sq Ft
$210/Sq Ft
Est. Value
About This Home
This home is located at 403 James Ln, Salisbury, MD 21801 and is currently estimated at $201,345, approximately $209 per square foot. 403 James Ln is a home located in Wicomico County with nearby schools including West Salisbury Elementary School, North Salisbury Elementary School, and Salisbury Middle School.
Ownership History
Date
Name
Owned For
Owner Type
Purchase Details
Closed on
Oct 2, 1998
Sold by
Stanley Deborah J
Bought by
Glovier George G and Glovier Doris C
Current Estimated Value
Purchase Details
Closed on
Oct 30, 1981
Sold by
Carter Solon and Carter Estelle B
Bought by
Stanley Deborah J
Home Financials for this Owner
Home Financials are based on the most recent Mortgage that was taken out on this home.
Original Mortgage
$32,500
Interest Rate
18.44%
Create a Home Valuation Report for This Property
The Home Valuation Report is an in-depth analysis detailing your home's value as well as a comparison with similar homes in the area
Home Values in the Area
Average Home Value in this Area
Purchase History
| Date | Buyer | Sale Price | Title Company |
|---|---|---|---|
| Glovier George G | $25,000 | -- | |
| Stanley Deborah J | $32,500 | -- |
Source: Public Records
Mortgage History
| Date | Status | Borrower | Loan Amount |
|---|---|---|---|
| Previous Owner | Stanley Deborah J | $32,500 |
Source: Public Records
Tax History
| Year | Tax Paid | Tax Assessment Tax Assessment Total Assessment is a certain percentage of the fair market value that is determined by local assessors to be the total taxable value of land and additions on the property. | Land | Improvement |
|---|---|---|---|---|
| 2025 | $1,230 | $121,033 | $0 | $0 |
| 2024 | $1,109 | $102,667 | $0 | $0 |
| 2023 | $958 | $84,300 | $14,700 | $69,600 |
| 2022 | $889 | $75,067 | $0 | $0 |
| 2021 | $797 | $65,833 | $0 | $0 |
| 2020 | $708 | $56,600 | $14,700 | $41,900 |
| 2019 | $652 | $56,600 | $14,700 | $41,900 |
| 2018 | $655 | $56,600 | $14,700 | $41,900 |
| 2017 | $761 | $66,600 | $0 | $0 |
| 2016 | -- | $66,000 | $0 | $0 |
| 2015 | $821 | $65,400 | $0 | $0 |
| 2014 | $821 | $64,800 | $0 | $0 |
Source: Public Records
Map
Nearby Homes
- 426 Dorsey Ln
- 667 Cook Dr
- 516 Purnell St
- 1505 Jersey Rd
- 516 Overbrook Dr
- 7925 Naas Rd
- 7877 Dublin Rd
- 0 Sandpiper Dr Unit MDWC2021640
- 1707 West Rd
- 7860 Bennett Park Dr
- 29167 Doubletree Dr
- 136 Marvel Rd
- 1712 Severn St
- 1817 Ocean Shore Ln
- 0 Queen Ave Unit MDWC2006982
- 907 Marquis Ave
- 827 Marquis Ave
- 813 Marquis Ave
- Lot C2 International Dr
- Lot D5 International Dr
Your Personal Tour Guide
Ask me questions while you tour the home.