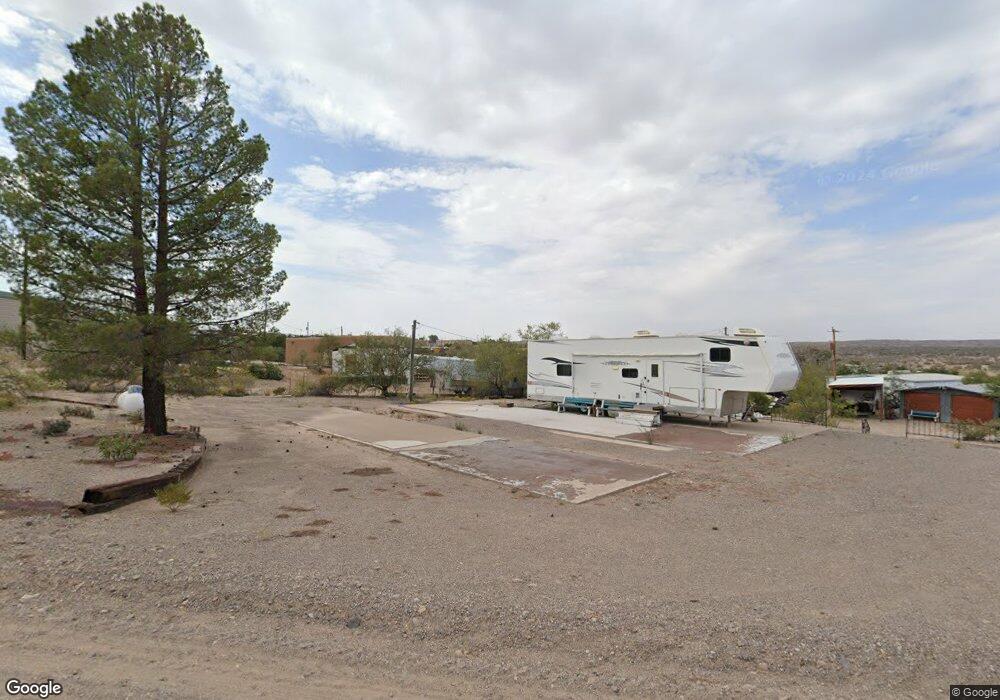
403 Lions Beach Rd Truth Or Consequences, NM 87901
Estimated Value: $193,000
4
Beds
2
Baths
1,772
Sq Ft
$109/Sq Ft
Est. Value
About This Home
This home is located at 403 Lions Beach Rd, Truth Or Consequences, NM 87901 and is currently estimated at $193,000, approximately $108 per square foot. 403 Lions Beach Rd is a home with nearby schools including Hot Springs High School.
Ownership History
Date
Name
Owned For
Owner Type
Purchase Details
Closed on
May 9, 2016
Sold by
Hanning John C and Hanning Renee A
Bought by
Johnson Chadwick D and Johnson Terese K
Current Estimated Value
Purchase Details
Closed on
May 22, 2013
Sold by
Hanning John C and Hanning Renee A
Bought by
Hanning John C and Hanning Renee A
Purchase Details
Closed on
Jan 26, 2006
Sold by
Roach William C and Roach Michelle M
Bought by
Hanning John C and Hanning Renee A
Purchase Details
Closed on
Sep 19, 2005
Sold by
D W Graham Enterprise Llc
Bought by
Roach William C and Roach Michelle M
Home Financials for this Owner
Home Financials are based on the most recent Mortgage that was taken out on this home.
Original Mortgage
$84,800
Interest Rate
7.75%
Mortgage Type
Purchase Money Mortgage
Purchase Details
Closed on
Dec 30, 2004
Sold by
The Elephant Butte
Bought by
D W Graham Enterprises Llc
Create a Home Valuation Report for This Property
The Home Valuation Report is an in-depth analysis detailing your home's value as well as a comparison with similar homes in the area
Home Values in the Area
Average Home Value in this Area
Purchase History
| Date | Buyer | Sale Price | Title Company |
|---|---|---|---|
| Johnson Chadwick D | -- | Sierra County Title Co | |
| Hanning John C | -- | None Available | |
| Hanning John C | -- | None Available | |
| Roach William C | -- | None Available | |
| D W Graham Enterprises Llc | -- | Title Services Of Sierra Cou |
Source: Public Records
Mortgage History
| Date | Status | Borrower | Loan Amount |
|---|---|---|---|
| Previous Owner | Roach William C | $84,800 |
Source: Public Records
Tax History
| Year | Tax Paid | Tax Assessment Tax Assessment Total Assessment is a certain percentage of the fair market value that is determined by local assessors to be the total taxable value of land and additions on the property. | Land | Improvement |
|---|---|---|---|---|
| 2025 | $820 | $31,121 | $29,140 | $1,981 |
| 2024 | $779 | $30,200 | $28,291 | $1,909 |
| 2023 | $779 | $36,074 | $26,667 | $9,407 |
| 2022 | $687 | $28,791 | $27,467 | $1,324 |
| 2021 | $889 | $36,074 | $26,667 | $9,407 |
| 2020 | $887 | $36,074 | $26,667 | $9,407 |
| 2019 | $878 | $36,074 | $26,667 | $9,407 |
| 2018 | $862 | $36,074 | $26,667 | $9,407 |
| 2017 | $853 | $36,074 | $26,667 | $9,407 |
| 2016 | $946 | $44,052 | $28,271 | $15,781 |
| 2015 | -- | $44,052 | $28,271 | $15,781 |
| 2014 | -- | $41,971 | $26,649 | $15,322 |
| 2013 | -- | $0 | $0 | $0 |
Source: Public Records
Map
Nearby Homes
- 506 Catfish Rd
- 516 Pike Rd
- 39 Underwood Blvd
- 520 Trout Rd
- 300 Catfish Rd
- 1003 Skyline Dr
- 526 Lakeshore Dr
- 109 Mimbres Rd
- 406 Skyline Dr
- 200 Springland Blvd
- 114 Canadian Cir
- 204 Superior Dr
- 707 Erie Ave
- VL Rio Grande Cir
- Lot 79 Rio Grande Cir
- 107 Idaho Ct
- 402 Skyline Dr
- 717 Erie Ave
- 716 Erie Ave
- 110 Palomas Ct
- 501 Catfish Rd
- 400 Lions Beach Rd
- 375 Lions Beach Rd
- 415 Lions Beach Rd
- 517 Catfish Rd
- 503 Catfish
- 307 Lions Beach Rd
- 307 Lions Beach
- 513 Catfish Rd
- 307 Lions Beach Rd
- 402 Lions Beach Rd
- 502 Pike Rd
- 537 Catfish Rd
- 543 Catfish Rd Unit AKA 511
- 523 Catfish Rd
- 500 Pike Rd
- 400 Lions Beach Rd
- 406 Lions Beach Rd
- 504 Catfish Rd
- 302 Lions Beach Rd
Your Personal Tour Guide
Ask me questions while you tour the home.