403 Maple Ct Runnells, IA 50237
Estimated Value: $330,000 - $368,000
Studio
4
Baths
1,633
Sq Ft
$212/Sq Ft
Est. Value
About This Home
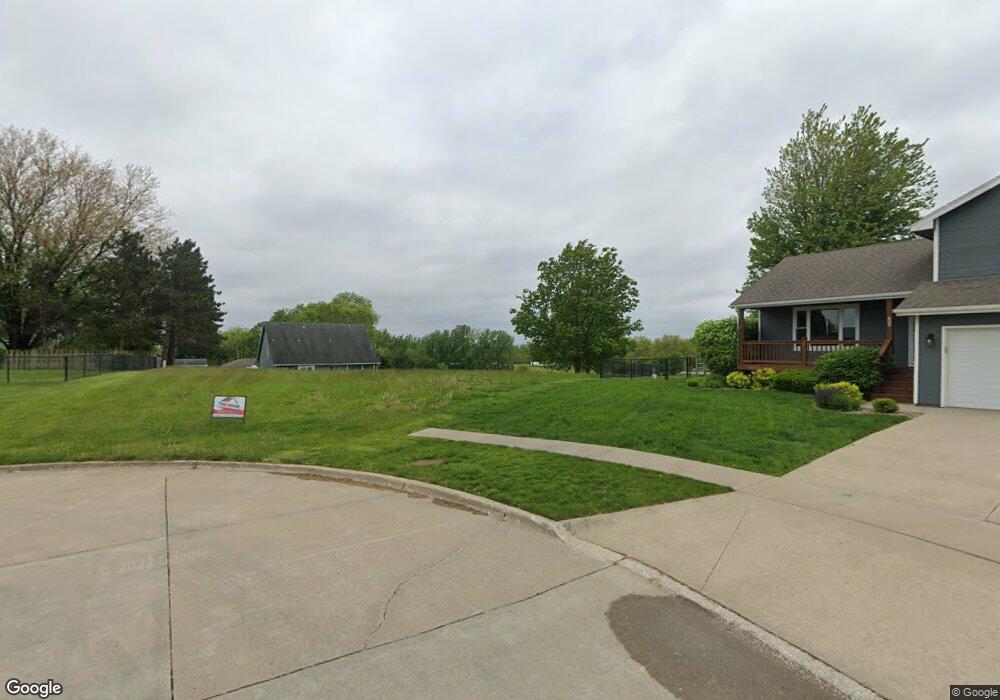
This home is located at 403 Maple Ct, Runnells, IA 50237 and is currently estimated at $347,011, approximately $212 per square foot. 403 Maple Ct is a home located in Polk County with nearby schools including Runnells Elementary School, Southeast Polk Spring Creek- 6th Grade, and Southeast Polk Junior High School.
Ownership History
Date
Name
Owned For
Owner Type
Purchase Details
Closed on
May 22, 2022
Sold by
Tinleehe Enterprises Llc
Bought by
Kinmonth Kameron G and Marienau Aspen R
Current Estimated Value
Home Financials for this Owner
Home Financials are based on the most recent Mortgage that was taken out on this home.
Original Mortgage
$16,250
Outstanding Balance
$11,464
Interest Rate
4.31%
Estimated Equity
$335,547
Purchase Details
Closed on
Nov 20, 2019
Sold by
Battles Elizabetha
Bought by
Tinleehe Enterprises Llc
Purchase Details
Closed on
Jun 19, 2013
Sold by
Battles Raymond A and Battles Elizabeth A
Bought by
Battles Raymond A and Battles Elizabeth A
Purchase Details
Closed on
Oct 15, 2006
Sold by
Harvey Christopher L and Harvey Jennifer L
Bought by
Battles Raymond A and Battles Elizabeth A
Create a Home Valuation Report for This Property
The Home Valuation Report is an in-depth analysis detailing your home's value as well as a comparison with similar homes in the area
Purchase History
| Date | Buyer | Sale Price | Title Company |
|---|---|---|---|
| Kinmonth Kameron G | $325,000 | Oeth Jacob M | |
| Tinleehe Enterprises Llc | $26,000 | None Available | |
| Battles Raymond A | -- | None Available | |
| Battles Raymond A | -- | None Available |
Source: Public Records
Mortgage History
| Date | Status | Borrower | Loan Amount |
|---|---|---|---|
| Open | Kinmonth Kameron G | $16,250 | |
| Open | Kinmonth Kameron G | $292,500 |
Source: Public Records
Tax History
| Year | Tax Paid | Tax Assessment Tax Assessment Total Assessment is a certain percentage of the fair market value that is determined by local assessors to be the total taxable value of land and additions on the property. | Land | Improvement |
|---|---|---|---|---|
| 2025 | $5,734 | $366,500 | $40,200 | $326,300 |
| 2024 | $5,734 | $327,300 | $35,500 | $291,800 |
| 2023 | $2,852 | $327,300 | $35,500 | $291,800 |
| 2022 | $440 | $142,600 | $22,300 | $120,300 |
| 2021 | $414 | $22,300 | $22,300 | $0 |
| 2020 | $408 | $20,000 | $20,000 | $0 |
| 2019 | $384 | $20,000 | $20,000 | $0 |
| 2018 | $384 | $17,500 | $17,500 | $0 |
| 2017 | $394 | $17,500 | $17,500 | $0 |
| 2016 | $394 | $16,100 | $16,100 | $0 |
| 2015 | $394 | $16,100 | $16,100 | $0 |
| 2014 | $380 | $15,600 | $15,600 | $0 |
Source: Public Records
Map
Nearby Homes
- 303 W Mckinney St
- 203 Brown St
- 12028 SE 64th Ave
- 3333 220th Ave
- 3380 SE 96th St
- 2493 SE 108th St
- 2360 SE 108th St
- 0 S 128th Ave W
- 10579 W 129th St S
- 410 N Vine St
- 1462 108th St SE
- 7930 SE Vandalia Dr
- 2456 SE 88th St
- 7820 SE Vandalia Dr
- 3350 SE 82nd St
- 24479 Elthon Place
- 2496 SE 83rd Ct
- 3356 SE 82nd St
- 2511 SE 82nd St
- 5825 G24 Hwy
- 405 Maple Ct
- 401 Maple Ct
- 402 W Park Ave
- 400 W Park Ave
- 402 Maple Ct
- 400 Maple Ct
- 307 Crestview Dr
- 308 W Park Ave
- 405 W Park Ave
- 403 W Park Ave
- 404 Crestview Dr
- 401 W Park Ave
- 403 Molly Ct
- 401 Crestview Dr
- 305 W Maple St
- 309 W Park Ave
- 405 Crestview Dr
- 304 W Park Ave
- 404 W Mckinney St
- 303 W Maple St
Your Personal Tour Guide
Ask me questions while you tour the home.