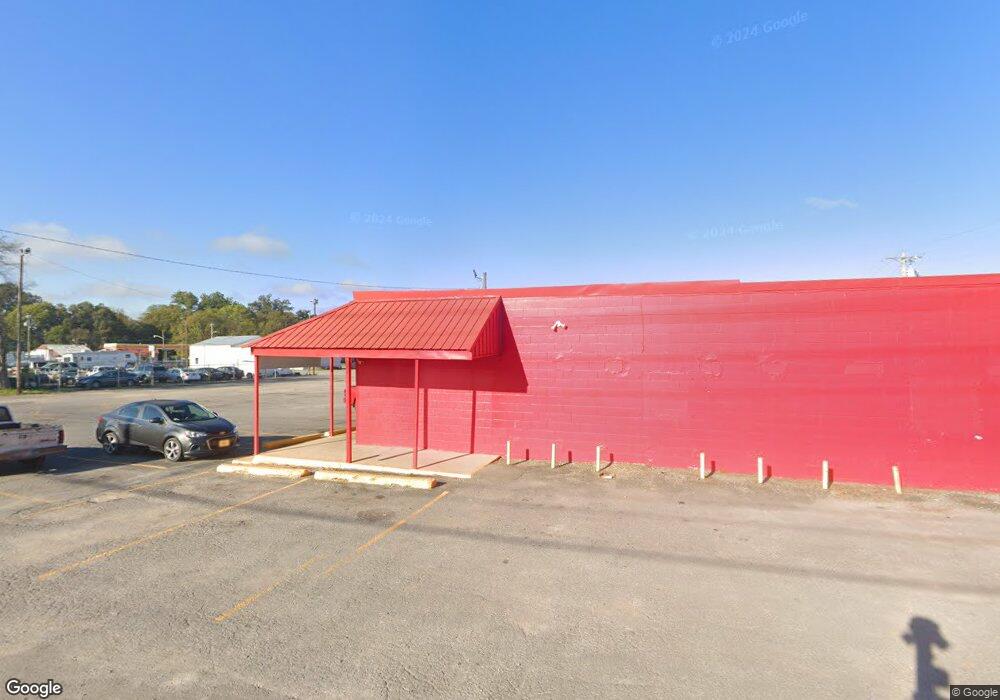
403 N Thompson St Shelbyville, TN 37160
Estimated Value: $216,574
--
Bed
1
Bath
9,493
Sq Ft
$23/Sq Ft
Est. Value
About This Home
This home is located at 403 N Thompson St, Shelbyville, TN 37160 and is currently estimated at $216,574, approximately $22 per square foot. 403 N Thompson St is a home located in Bedford County with nearby schools including East Side Elementary School, Harris Middle School, and Christian Chapel Academy.
Ownership History
Date
Name
Owned For
Owner Type
Purchase Details
Closed on
Sep 28, 2017
Sold by
Hornaday Judy Kaye
Bought by
Cruces Gloria and Cruces Felipe
Current Estimated Value
Home Financials for this Owner
Home Financials are based on the most recent Mortgage that was taken out on this home.
Original Mortgage
$119,200
Outstanding Balance
$99,326
Interest Rate
3.82%
Mortgage Type
Unknown
Estimated Equity
$117,248
Purchase Details
Closed on
Mar 26, 2015
Sold by
International Medical Assistan
Bought by
Hornaday Judy Kaye
Purchase Details
Closed on
Jun 11, 1998
Sold by
Cartwright Bobby
Bought by
International Medical Assi
Purchase Details
Closed on
Jul 30, 1988
Bought by
Cartwright Bobby
Purchase Details
Closed on
Oct 16, 1986
Bought by
Cartwright Bobby
Purchase Details
Closed on
May 7, 1976
Bought by
Cartwright Thomas
Purchase Details
Closed on
May 6, 1976
Create a Home Valuation Report for This Property
The Home Valuation Report is an in-depth analysis detailing your home's value as well as a comparison with similar homes in the area
Home Values in the Area
Average Home Value in this Area
Purchase History
| Date | Buyer | Sale Price | Title Company |
|---|---|---|---|
| Cruces Gloria | -- | None Available | |
| Hornaday Judy Kaye | $89,000 | -- | |
| International Medical Assi | $105,000 | -- | |
| Cartwright Bobby | $1,000 | -- | |
| Cartwright Bobby | $25,000 | -- | |
| Cartwright Thomas | -- | -- | |
| -- | -- | -- |
Source: Public Records
Mortgage History
| Date | Status | Borrower | Loan Amount |
|---|---|---|---|
| Open | Cruces Gloria | $119,200 |
Source: Public Records
Tax History Compared to Growth
Tax History
| Year | Tax Paid | Tax Assessment Tax Assessment Total Assessment is a certain percentage of the fair market value that is determined by local assessors to be the total taxable value of land and additions on the property. | Land | Improvement |
|---|---|---|---|---|
| 2025 | -- | $134,040 | $0 | $0 |
| 2024 | -- | $134,040 | $8,600 | $125,440 |
| 2023 | $5,101 | $134,040 | $8,600 | $125,440 |
| 2022 | $5,248 | $134,040 | $8,600 | $125,440 |
| 2021 | $4,765 | $134,040 | $8,600 | $125,440 |
| 2020 | $2,493 | $134,040 | $8,600 | $125,440 |
| 2019 | $2,493 | $56,280 | $4,400 | $51,880 |
| 2018 | $2,437 | $56,280 | $4,400 | $51,880 |
| 2017 | $2,437 | $56,280 | $4,400 | $51,880 |
| 2016 | $2,414 | $56,280 | $4,400 | $51,880 |
| 2015 | $2,414 | $56,280 | $4,400 | $51,880 |
| 2014 | $1,704 | $43,457 | $0 | $0 |
Source: Public Records
Map
Nearby Homes
- 0 E Depot St
- 220 Walnut St
- 709 Belmont Ave
- 464 Whitthorne St
- 112 Elizabeth St
- 207 Martha St
- 627 E Lane St
- 631 E Lane St
- 527 Deery St
- 211 S Fairoak St
- 713 King Ave
- 714 King Ave
- 314 Maplewood Dr
- 120 Dogwood Ct
- 102 Germantown Rd
- 724 Alton Ave
- 636 Deery St
- 215 Coney Island Rd
- 107 Rockwood Dr
- 0 Hilltop Rd Unit RTC2897754
- 0 Special Ct Unit 2074278
- 345 Shirley Rd
- 1 Depot St E
- 1 Depot St
- 419 Thompson St
- 0S Carr Creek Rd
- 205 N Thompson St
- 420 E Depot St
- 420 E Depot St
- 106 S Thompson St
- 506 Highland Ct
- 505 1/2 Belmont Ave
- 505 Belmont Ave
- 419 Belmont Ave
- 411 Belmont Ave
- 501 Highland Ct
- 501 Belmont Ave
- 500 Depot St
- 503 Belmont Ave
- 510 Highland Ct