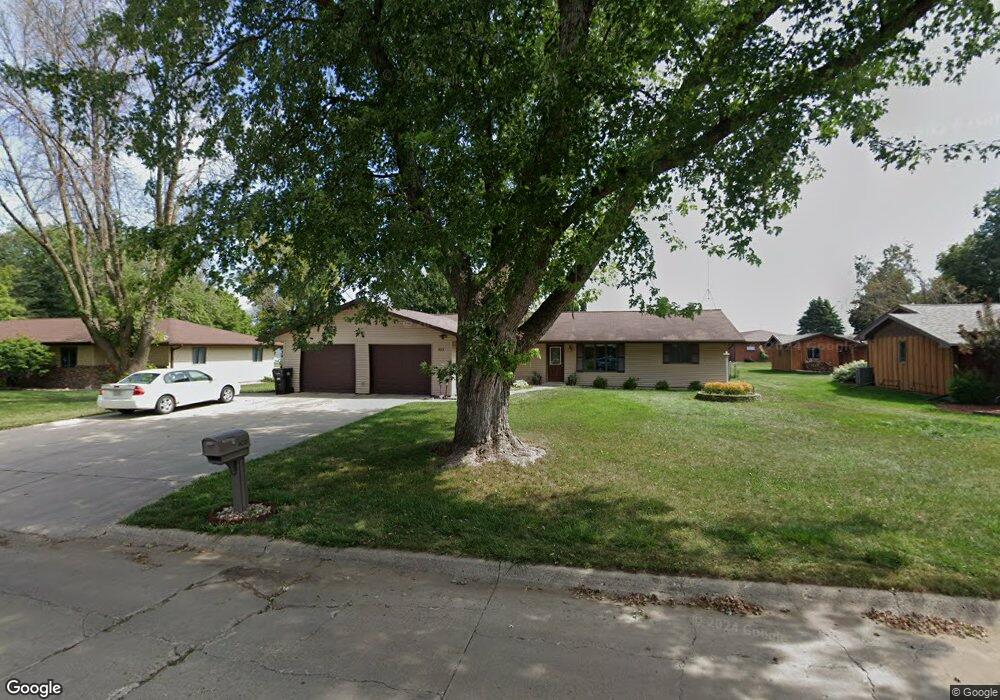
403 Ridgeway Dr Marcus, IA 51035
Estimated Value: $255,867 - $388,000
--
Bed
3
Baths
1,980
Sq Ft
$147/Sq Ft
Est. Value
About This Home
This home is located at 403 Ridgeway Dr, Marcus, IA 51035 and is currently estimated at $290,967, approximately $146 per square foot. 403 Ridgeway Dr is a home located in Cherokee County with nearby schools including MMCRU Marcus Elementary School and MMCRU High School.
Ownership History
Date
Name
Owned For
Owner Type
Purchase Details
Closed on
Jul 11, 2018
Sold by
Johnson Randall D and Johnson Barbara J
Bought by
Bork Robert and Bork Chelsea
Current Estimated Value
Home Financials for this Owner
Home Financials are based on the most recent Mortgage that was taken out on this home.
Original Mortgage
$213,750
Outstanding Balance
$185,246
Interest Rate
4.5%
Mortgage Type
New Conventional
Estimated Equity
$105,721
Purchase Details
Closed on
Feb 10, 2005
Sold by
The Estate Of Ruby A Gross
Bought by
Johnson Randall D and Johnson Barbara J
Home Financials for this Owner
Home Financials are based on the most recent Mortgage that was taken out on this home.
Original Mortgage
$110,000
Interest Rate
5.78%
Mortgage Type
New Conventional
Create a Home Valuation Report for This Property
The Home Valuation Report is an in-depth analysis detailing your home's value as well as a comparison with similar homes in the area
Purchase History
| Date | Buyer | Sale Price | Title Company |
|---|---|---|---|
| Bork Robert | $225,000 | None Available | |
| Johnson Randall D | $110,000 | None Available |
Source: Public Records
Mortgage History
| Date | Status | Borrower | Loan Amount |
|---|---|---|---|
| Open | Bork Robert | $213,750 | |
| Previous Owner | Johnson Randall D | $110,000 |
Source: Public Records
Tax History
| Year | Tax Paid | Tax Assessment Tax Assessment Total Assessment is a certain percentage of the fair market value that is determined by local assessors to be the total taxable value of land and additions on the property. | Land | Improvement |
|---|---|---|---|---|
| 2025 | $3,198 | $261,990 | $22,500 | $239,490 |
| 2024 | $3,198 | $237,230 | $22,500 | $214,730 |
| 2023 | $3,124 | $237,230 | $22,500 | $214,730 |
| 2022 | $3,154 | $199,720 | $22,500 | $177,220 |
| 2021 | $3,154 | $199,720 | $22,500 | $177,220 |
| 2020 | $3,068 | $199,720 | $22,500 | $177,220 |
| 2019 | $3,142 | $199,720 | $0 | $0 |
| 2018 | $2,660 | $170,864 | $0 | $0 |
| 2017 | $2,660 | $170,864 | $0 | $0 |
| 2016 | $2,790 | $170,864 | $0 | $0 |
| 2015 | $2,514 | $146,038 | $0 | $0 |
| 2014 | $2,516 | $146,038 | $0 | $0 |
Source: Public Records
Map
Nearby Homes
- 405 Ridgeway Dr
- 401 Ridgeway Dr
- 305 E Highland Dr
- 302 Crestview Dr
- 307 E Highland Dr
- 208 Crestview Dr
- 402 Ridgeway Dr
- 400 Ridgeway Dr
- 302 E Highland Dr
- 301 Crestview Dr
- 303 Crestview Dr
- 300 E Highland Dr
- 206 Crestview Dr
- 305 Crestview Dr
- 311 Ridgeway Dr
- 208 E Highland Dr
- 209 Crestview Dr
- 312 S Elm St
- 205 E Highland Dr
- 308 Ridgeway Dr
Your Personal Tour Guide
Ask me questions while you tour the home.