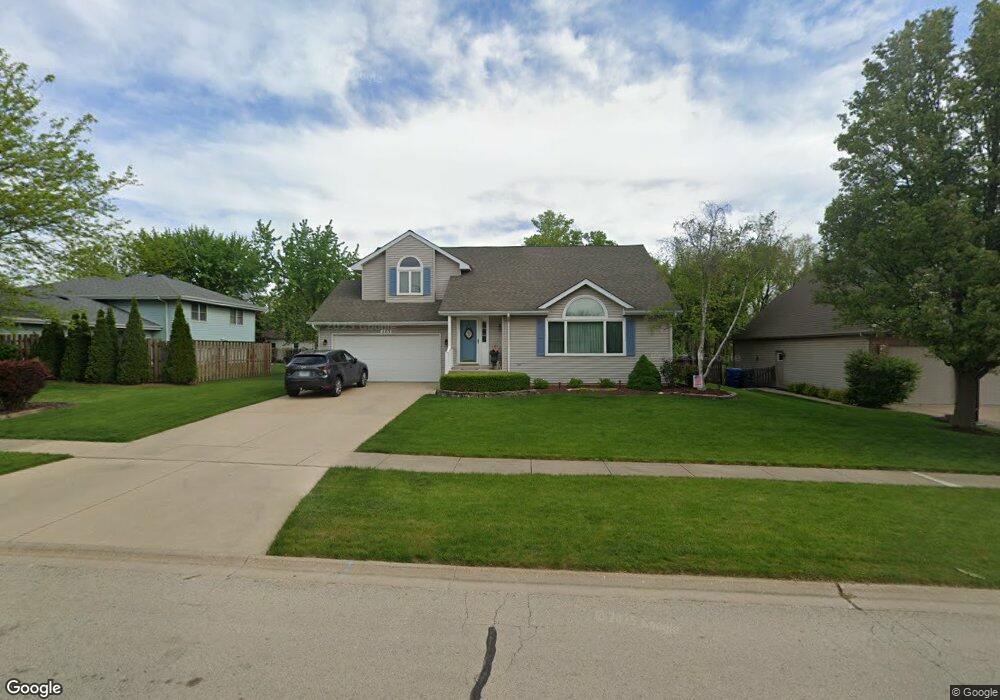
403 Riverview Ct Minooka, IL 60447
South DuPage River NeighborhoodEstimated Value: $261,026 - $400,000
Studio
--
Bath
1,590
Sq Ft
$215/Sq Ft
Est. Value
About This Home
This home is located at 403 Riverview Ct, Minooka, IL 60447 and is currently estimated at $341,757, approximately $214 per square foot. 403 Riverview Ct is a home located in Will County with nearby schools including N B Galloway Elementary School, Three Rivers School, and Pioneer Path School.
Ownership History
Date
Name
Owned For
Owner Type
Purchase Details
Closed on
Apr 30, 1996
Sold by
Langejans Scott G and Langejans Michele M
Bought by
Tolbert Leslie W and Tolbert Carol A
Current Estimated Value
Home Financials for this Owner
Home Financials are based on the most recent Mortgage that was taken out on this home.
Original Mortgage
$139,400
Outstanding Balance
$7,137
Interest Rate
6.87%
Estimated Equity
$334,620
Purchase Details
Closed on
Aug 5, 1994
Sold by
Innovative Builders Inc
Bought by
Langejans Scott G and Langejans Michele M
Home Financials for this Owner
Home Financials are based on the most recent Mortgage that was taken out on this home.
Original Mortgage
$90,000
Interest Rate
6.62%
Purchase Details
Closed on
Apr 5, 1994
Sold by
Rivers Edge Investment Co
Bought by
Innovative Builders Inc
Create a Home Valuation Report for This Property
The Home Valuation Report is an in-depth analysis detailing your home's value as well as a comparison with similar homes in the area
Home Values in the Area
Average Home Value in this Area
Purchase History
| Date | Buyer | Sale Price | Title Company |
|---|---|---|---|
| Tolbert Leslie W | $155,000 | -- | |
| Langejans Scott G | $131,500 | -- | |
| Innovative Builders Inc | $28,500 | -- |
Source: Public Records
Mortgage History
| Date | Status | Borrower | Loan Amount |
|---|---|---|---|
| Open | Tolbert Leslie W | $139,400 | |
| Previous Owner | Langejans Scott G | $90,000 |
Source: Public Records
Tax History
| Year | Tax Paid | Tax Assessment Tax Assessment Total Assessment is a certain percentage of the fair market value that is determined by local assessors to be the total taxable value of land and additions on the property. | Land | Improvement |
|---|---|---|---|---|
| 2024 | $4,416 | $88,165 | $26,274 | $61,891 |
| 2023 | $4,416 | $83,936 | $23,188 | $60,748 |
| 2022 | $4,890 | $78,717 | $21,746 | $56,971 |
| 2021 | $4,886 | $74,402 | $20,554 | $53,848 |
| 2020 | $4,895 | $72,801 | $20,112 | $52,689 |
| 2019 | $5,391 | $69,500 | $19,200 | $50,300 |
| 2018 | $4,984 | $64,458 | $18,305 | $46,153 |
| 2017 | $4,581 | $58,892 | $17,558 | $41,334 |
| 2016 | $4,457 | $56,518 | $16,850 | $39,668 |
| 2015 | $4,148 | $54,550 | $15,850 | $38,700 |
| 2014 | $4,148 | $53,950 | $15,850 | $38,100 |
| 2013 | $4,148 | $53,950 | $15,850 | $38,100 |
Source: Public Records
Map
Nearby Homes
- 517 Rivers Edge Dr
- 521 Rivers Edge Dr
- 103 Northfield Dr
- 105 Northfield Dr
- 323 Vista Ct Unit B
- 9015 E Mcevilly Rd
- 105 Blackhawk Dr
- 214 Deerpath Dr
- 25734 Hickory Ct
- 204 N Wabasso St
- 701 Davidson Dr Unit B
- 201 W Church St
- 24055 S Lakeview Dr
- 405 W Mondamin St
- 24412 S Dupage Dr
- LOT 1 Bob Blair Rd
- 1158 Indian Grass Ct
- 330 Clover Cir
- 332 Clover Cir
- 334 Clover Cir
- 106 Sibley Dr
- 405 Riverview Ct
- 104 Sibley Dr
- 407 Riverview Ct
- 402 Riverview Ct
- 102 Sibley Dr
- 404 Riverview Ct
- 400 Riverview Ct
- 409 Riverview Ct
- 406 Riverview Ct
- 109 Sibley Dr
- 408 Riverview Ct
- 410 Riverview Ct
- 111 Sibley Dr
- 105 Sibley Dr
- 100 Sibley Dr
- 402 Rivers Edge Dr
- 103 Sibley Dr
- 101 Sibley Dr
- 106 Fieldcrest Ct
Your Personal Tour Guide
Ask me questions while you tour the home.