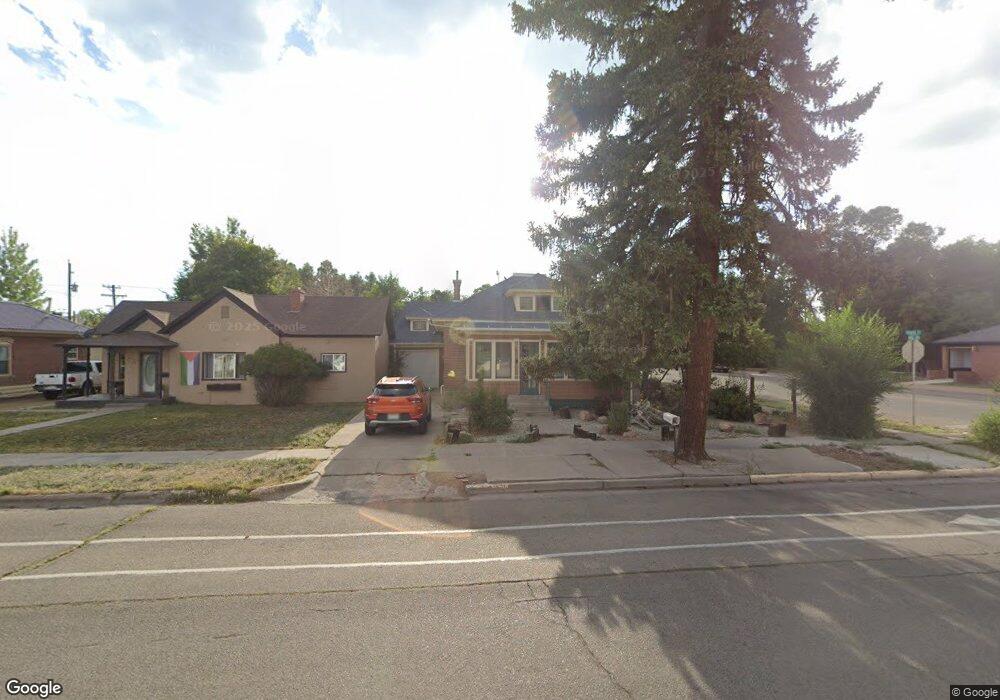
403 Ross Ave Alamosa, CO 81101
Estimated Value: $276,000 - $344,000
3
Beds
2
Baths
1,704
Sq Ft
$173/Sq Ft
Est. Value
About This Home
This home is located at 403 Ross Ave, Alamosa, CO 81101 and is currently estimated at $294,738, approximately $172 per square foot. 403 Ross Ave is a home located in Alamosa County with nearby schools including Alamosa Elementary School, Ortega Middle School, and Alamosa High School.
Ownership History
Date
Name
Owned For
Owner Type
Purchase Details
Closed on
Aug 25, 2016
Sold by
Atencio Stephane W and Atencio Lisa M
Bought by
Burkhardt Laura Kay
Current Estimated Value
Home Financials for this Owner
Home Financials are based on the most recent Mortgage that was taken out on this home.
Original Mortgage
$169,665
Outstanding Balance
$135,478
Interest Rate
3.42%
Mortgage Type
Commercial
Estimated Equity
$159,260
Purchase Details
Closed on
Jul 12, 2016
Sold by
Atencio Stephane
Bought by
Atencio Stephane W and Atencio Lisa M
Home Financials for this Owner
Home Financials are based on the most recent Mortgage that was taken out on this home.
Original Mortgage
$169,665
Outstanding Balance
$135,478
Interest Rate
3.42%
Mortgage Type
Commercial
Estimated Equity
$159,260
Purchase Details
Closed on
Jul 13, 1992
Sold by
Carr Patti A
Bought by
Atencio Stephane
Purchase Details
Closed on
May 14, 1987
Sold by
Reed James K
Bought by
Carr Patti A
Purchase Details
Closed on
Apr 6, 1984
Sold by
Andis Ada E
Bought by
Reed James K
Create a Home Valuation Report for This Property
The Home Valuation Report is an in-depth analysis detailing your home's value as well as a comparison with similar homes in the area
Home Values in the Area
Average Home Value in this Area
Purchase History
| Date | Buyer | Sale Price | Title Company |
|---|---|---|---|
| Burkhardt Laura Kay | $165,000 | None Available | |
| Atencio Stephane W | -- | None Available | |
| Atencio Stephane | $62,000 | -- | |
| Carr Patti A | $23,500 | -- | |
| Reed James K | $38,200 | -- |
Source: Public Records
Mortgage History
| Date | Status | Borrower | Loan Amount |
|---|---|---|---|
| Open | Burkhardt Laura Kay | $169,665 |
Source: Public Records
Tax History Compared to Growth
Tax History
| Year | Tax Paid | Tax Assessment Tax Assessment Total Assessment is a certain percentage of the fair market value that is determined by local assessors to be the total taxable value of land and additions on the property. | Land | Improvement |
|---|---|---|---|---|
| 2024 | $859 | $15,300 | $1,508 | $13,792 |
| 2023 | $880 | $16,066 | $1,522 | $14,544 |
| 2022 | $942 | $12,251 | $1,073 | $11,178 |
| 2021 | $969 | $12,251 | $1,073 | $11,178 |
| 2020 | $895 | $12,251 | $1,073 | $11,178 |
| 2019 | $898 | $11,127 | $1,073 | $10,054 |
| 2018 | $921 | $11,204 | $1,080 | $10,124 |
| 2017 | $922 | $11,204 | $1,080 | $10,124 |
| 2016 | $949 | $29,968 | $6,525 | $23,443 |
| 2015 | -- | $29,968 | $6,525 | $23,443 |
| 2014 | -- | $29,969 | $6,525 | $23,444 |
| 2013 | -- | $29,969 | $6,525 | $23,444 |
Source: Public Records
Map
Nearby Homes
- 302 Bell Ave
- 0 U S 160
- Lot 14 Fourth St
- 531 Alamosa Ave
- 1623-B 6th St
- 400 & 406 6th St
- 0 Mountain View Blvd Unit 23881373
- 735 First St
- 24 Alamosa Ave
- 631 2nd St
- 6 Mountain View Place
- 6 Bellwood Dr
- 119 Poncha Ave
- 1330 W 7th St
- 1002 Edison Ave
- 125 Lots Cottonwoods Phase II
- 1374 N Co Road 110
- 82 Monterey Ave
- 1121 San Juan Ave
- 1523 W 8th St
- 0 Ross Ave Unit 767937
- 0 Ross Ave Unit 761724
- 0 Ross Ave Unit 756271
- 0 Ross Ave Unit 751614
- 0 Ross Ave Unit 751372
- 0 Ross Ave Unit 746621
- 0 Ross Ave Unit 746230
- 0 Ross Ave Unit 746203
- 0 Ross Ave Unit 737139
- 0 Ross Ave Unit 650194
- 0 Ross Ave Unit 655708
- 0 Ross Ave Unit 662457
- 0 Ross Ave Unit 703205
- 0 Ross Ave Unit 717207
- 0 Ross Ave Unit 650929
- 0 Ross Ave Unit 685130
- 0 Ross Ave Unit 685129
- 0 Ross Ave Unit 690120
- 0 Ross Ave Unit 703706
- 0 Ross Ave Unit 703705