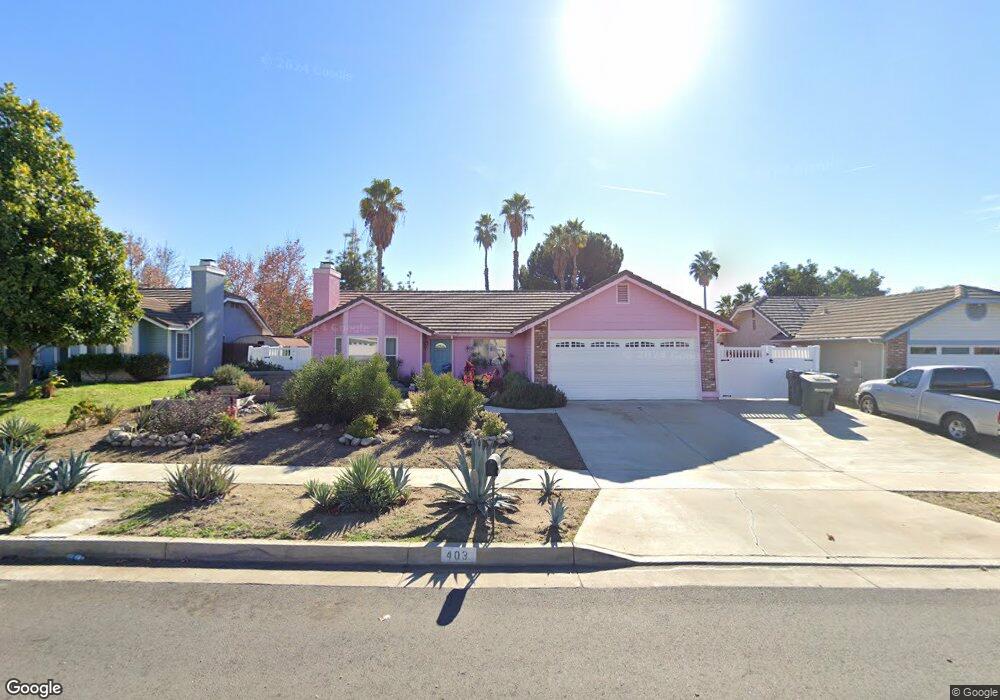
403 Ruby Ave Redlands, CA 92374
North Redlands NeighborhoodEstimated Value: $537,000 - $579,000
3
Beds
2
Baths
1,361
Sq Ft
$405/Sq Ft
Est. Value
About This Home
This home is located at 403 Ruby Ave, Redlands, CA 92374 and is currently estimated at $551,175, approximately $404 per square foot. 403 Ruby Ave is a home located in San Bernardino County with nearby schools including Lugonia Elementary School, Clement Middle School, and Citrus Valley High School.
Ownership History
Date
Name
Owned For
Owner Type
Purchase Details
Closed on
Jun 14, 2002
Sold by
Mata Tony J and Mata Eva L
Bought by
Escobar Maria M and Castellanos Nancy C
Current Estimated Value
Home Financials for this Owner
Home Financials are based on the most recent Mortgage that was taken out on this home.
Original Mortgage
$167,200
Interest Rate
6.7%
Mortgage Type
FHA
Purchase Details
Closed on
Nov 2, 1998
Sold by
Iosifidis Peter
Bought by
Mata Tony J and Mata Eva L
Home Financials for this Owner
Home Financials are based on the most recent Mortgage that was taken out on this home.
Original Mortgage
$111,670
Interest Rate
6.69%
Mortgage Type
FHA
Create a Home Valuation Report for This Property
The Home Valuation Report is an in-depth analysis detailing your home's value as well as a comparison with similar homes in the area
Home Values in the Area
Average Home Value in this Area
Purchase History
| Date | Buyer | Sale Price | Title Company |
|---|---|---|---|
| Escobar Maria M | $170,000 | Commerce Title | |
| Mata Tony J | $113,000 | Lawyers Title Company |
Source: Public Records
Mortgage History
| Date | Status | Borrower | Loan Amount |
|---|---|---|---|
| Previous Owner | Escobar Maria M | $167,200 | |
| Previous Owner | Mata Tony J | $111,670 |
Source: Public Records
Tax History
| Year | Tax Paid | Tax Assessment Tax Assessment Total Assessment is a certain percentage of the fair market value that is determined by local assessors to be the total taxable value of land and additions on the property. | Land | Improvement |
|---|---|---|---|---|
| 2025 | $2,998 | $246,220 | $61,554 | $184,666 |
| 2024 | $2,799 | $241,392 | $60,347 | $181,045 |
| 2023 | $2,794 | $236,659 | $59,164 | $177,495 |
| 2022 | $2,752 | $232,019 | $58,004 | $174,015 |
| 2021 | $2,801 | $227,470 | $56,867 | $170,603 |
| 2020 | $2,758 | $225,138 | $56,284 | $168,854 |
| 2019 | $2,680 | $220,723 | $55,180 | $165,543 |
| 2018 | $2,612 | $216,395 | $54,098 | $162,297 |
| 2017 | $2,588 | $212,152 | $53,037 | $159,115 |
| 2016 | $2,558 | $207,992 | $51,997 | $155,995 |
| 2015 | $2,626 | $204,868 | $51,216 | $153,652 |
| 2014 | $2,579 | $200,855 | $50,213 | $150,642 |
Source: Public Records
Map
Nearby Homes
- 1225 Alta St
- 887 Carlotta Ct
- 831 W Lugonia Ave
- 1024 Lawton St
- 838 W Brockton Ave
- 903 Webster St
- 915 Alta St
- 127 W Colton Ave
- 1602 Glover St
- 610 E Lugonia Ave Unit 4
- 833 Half Moon Ave
- 227 Mulvihill Ave
- 122 E Pioneer Ave
- 323 E Colton Ave
- 140 W Pioneer Ave Unit 38
- 140 W Pioneer Ave Unit 31
- 1539 Robyn St
- 853 Railway Ln
- 873 Railway Ln
- 848 Railway Ln
Your Personal Tour Guide
Ask me questions while you tour the home.