Estimated Value: $192,000 - $258,000
3
Beds
2
Baths
1,188
Sq Ft
$189/Sq Ft
Est. Value
About This Home
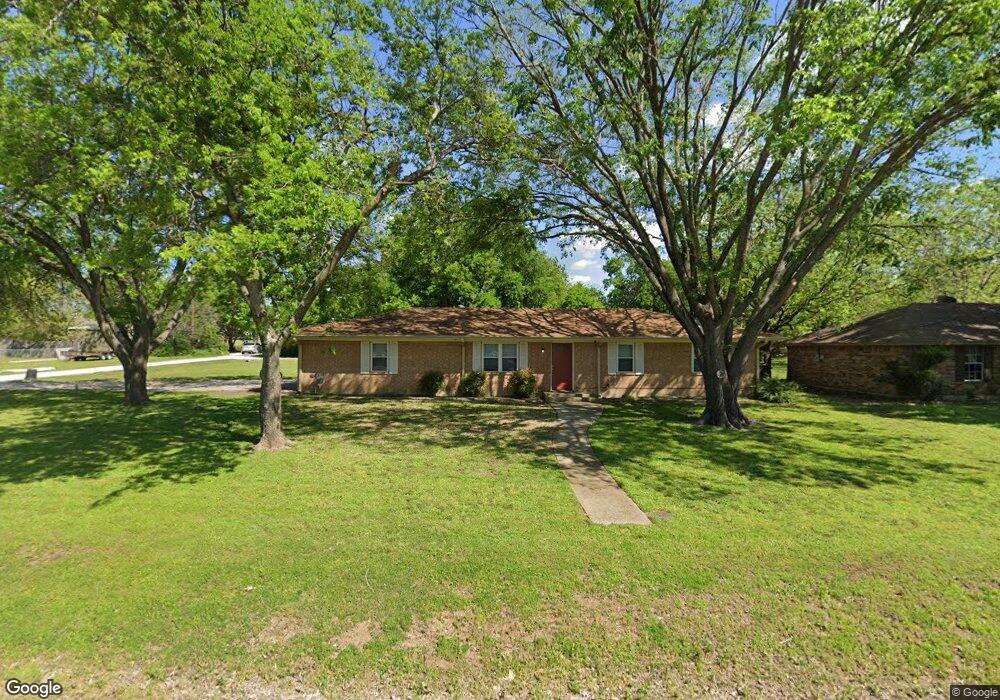
This home is located at 403 S 2nd St, Krum, TX 76249 and is currently estimated at $224,883, approximately $189 per square foot. 403 S 2nd St is a home located in Denton County with nearby schools including Krum Early Education Center, Dyer Elementary School, and Krum Middle School.
Ownership History
Date
Name
Owned For
Owner Type
Purchase Details
Closed on
Sep 8, 2017
Sold by
Not Quite 4A Properties Lp
Bought by
Marquis Investment Properties Llc
Current Estimated Value
Purchase Details
Closed on
Oct 20, 2005
Sold by
Andrus Brad Darren
Bought by
4A Properties Ltd
Purchase Details
Closed on
Apr 9, 2004
Sold by
Baird William A and Baird Sylvia
Bought by
Andrus Brad Darren
Home Financials for this Owner
Home Financials are based on the most recent Mortgage that was taken out on this home.
Original Mortgage
$90,500
Interest Rate
5.61%
Mortgage Type
Purchase Money Mortgage
Purchase Details
Closed on
Sep 17, 2003
Sold by
Green Betty Lou
Bought by
Baird William A and Baird Sylvia
Home Financials for this Owner
Home Financials are based on the most recent Mortgage that was taken out on this home.
Original Mortgage
$52,500
Interest Rate
6.5%
Mortgage Type
Purchase Money Mortgage
Create a Home Valuation Report for This Property
The Home Valuation Report is an in-depth analysis detailing your home's value as well as a comparison with similar homes in the area
Home Values in the Area
Average Home Value in this Area
Purchase History
| Date | Buyer | Sale Price | Title Company |
|---|---|---|---|
| Marquis Investment Properties Llc | -- | Title Resources | |
| Not Quite 4A Properties Lp | -- | Title Resources | |
| 4A Properties Ltd | -- | None Available | |
| Andrus Brad Darren | -- | -- | |
| Baird William A | -- | -- |
Source: Public Records
Mortgage History
| Date | Status | Borrower | Loan Amount |
|---|---|---|---|
| Previous Owner | Andrus Brad Darren | $90,500 | |
| Previous Owner | Baird William A | $52,500 | |
| Closed | 4A Properties Ltd | $0 |
Source: Public Records
Tax History Compared to Growth
Tax History
| Year | Tax Paid | Tax Assessment Tax Assessment Total Assessment is a certain percentage of the fair market value that is determined by local assessors to be the total taxable value of land and additions on the property. | Land | Improvement |
|---|---|---|---|---|
| 2025 | $3,461 | $142,538 | $64,225 | $78,313 |
| 2024 | $3,461 | $171,753 | $64,225 | $107,528 |
| 2023 | $3,210 | $159,000 | $64,225 | $94,775 |
| 2022 | $3,211 | $140,000 | $48,628 | $91,372 |
| 2021 | $2,505 | $112,979 | $38,535 | $74,444 |
| 2020 | $2,669 | $117,860 | $38,535 | $79,325 |
| 2019 | $2,870 | $118,926 | $38,535 | $80,391 |
| 2018 | $2,723 | $112,286 | $38,535 | $73,751 |
| 2017 | $2,131 | $87,500 | $29,360 | $58,140 |
| 2016 | $1,012 | $41,536 | $14,680 | $26,856 |
| 2015 | $1,731 | $74,362 | $29,360 | $45,002 |
| 2013 | -- | $67,326 | $29,360 | $37,966 |
Source: Public Records
Map
Nearby Homes