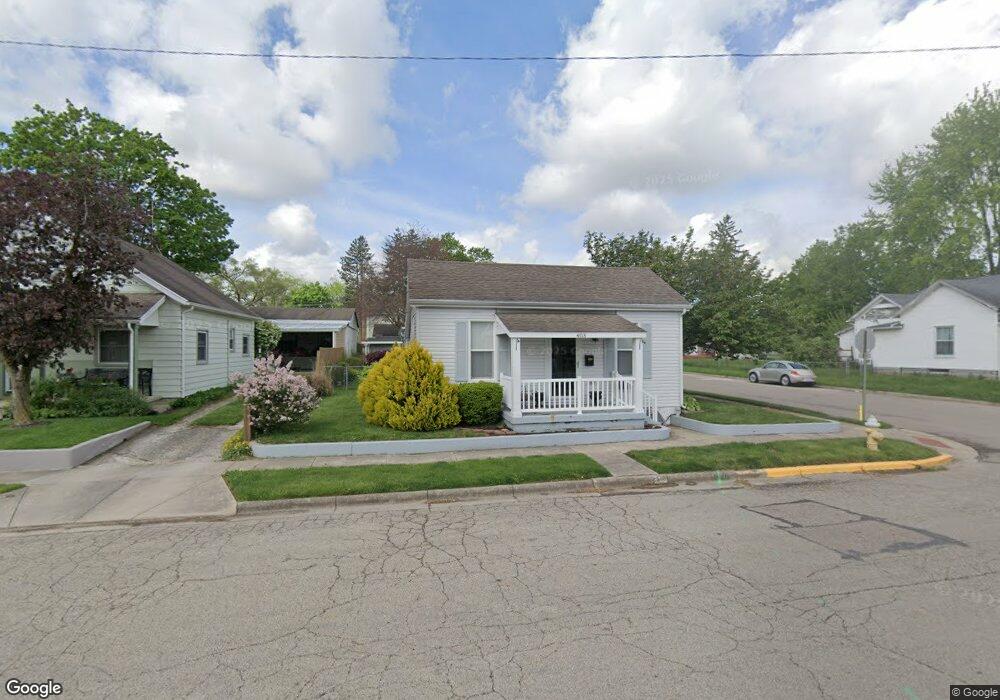
403 S 3rd St Tipp City, OH 45371
Estimated Value: $218,000 - $237,000
2
Beds
1
Bath
1,456
Sq Ft
$157/Sq Ft
Est. Value
About This Home
This home is located at 403 S 3rd St, Tipp City, OH 45371 and is currently estimated at $228,650, approximately $157 per square foot. 403 S 3rd St is a home located in Miami County with nearby schools including Broadway Elementary School, Nevin Coppock Elementary School, and L. T. Ball Intermediate School.
Ownership History
Date
Name
Owned For
Owner Type
Purchase Details
Closed on
Nov 28, 2006
Sold by
Haer Kevin A and Haer Jamie Sue
Bought by
Honeyman Bradley J and Honeyman Christine A
Current Estimated Value
Home Financials for this Owner
Home Financials are based on the most recent Mortgage that was taken out on this home.
Original Mortgage
$87,000
Outstanding Balance
$52,303
Interest Rate
6.41%
Mortgage Type
New Conventional
Estimated Equity
$176,347
Purchase Details
Closed on
Mar 7, 2006
Sold by
Hsbc Mortgage Services Inc
Bought by
Haer Kevin A and Haer Jamie Sue
Purchase Details
Closed on
Jun 24, 2005
Sold by
Brown George S and Brown Vickie E
Bought by
Hsbc Mortgage Services Inc
Purchase Details
Closed on
Jun 1, 1981
Bought by
Brown George S
Create a Home Valuation Report for This Property
The Home Valuation Report is an in-depth analysis detailing your home's value as well as a comparison with similar homes in the area
Home Values in the Area
Average Home Value in this Area
Purchase History
| Date | Buyer | Sale Price | Title Company |
|---|---|---|---|
| Honeyman Bradley J | $87,000 | -- | |
| Haer Kevin A | $28,000 | -- | |
| Hsbc Mortgage Services Inc | -- | -- | |
| Brown George S | $18,500 | -- |
Source: Public Records
Mortgage History
| Date | Status | Borrower | Loan Amount |
|---|---|---|---|
| Open | Hsbc Mortgage Services Inc | $87,000 | |
| Closed | Hsbc Mortgage Services Inc | -- |
Source: Public Records
Tax History Compared to Growth
Tax History
| Year | Tax Paid | Tax Assessment Tax Assessment Total Assessment is a certain percentage of the fair market value that is determined by local assessors to be the total taxable value of land and additions on the property. | Land | Improvement |
|---|---|---|---|---|
| 2024 | $2,741 | $55,060 | $14,070 | $40,990 |
| 2023 | $2,741 | $55,060 | $14,070 | $40,990 |
| 2022 | $2,498 | $55,060 | $14,070 | $40,990 |
| 2021 | $2,120 | $42,360 | $10,820 | $31,540 |
| 2020 | $2,146 | $42,360 | $10,820 | $31,540 |
| 2019 | $2,165 | $42,360 | $10,820 | $31,540 |
| 2018 | $1,649 | $30,110 | $10,540 | $19,570 |
| 2017 | $1,655 | $30,110 | $10,540 | $19,570 |
| 2016 | $1,600 | $30,110 | $10,540 | $19,570 |
| 2015 | $1,398 | $27,900 | $9,770 | $18,130 |
| 2014 | $1,398 | $27,900 | $9,770 | $18,130 |
| 2013 | $1,405 | $27,900 | $9,770 | $18,130 |
Source: Public Records
Map
Nearby Homes