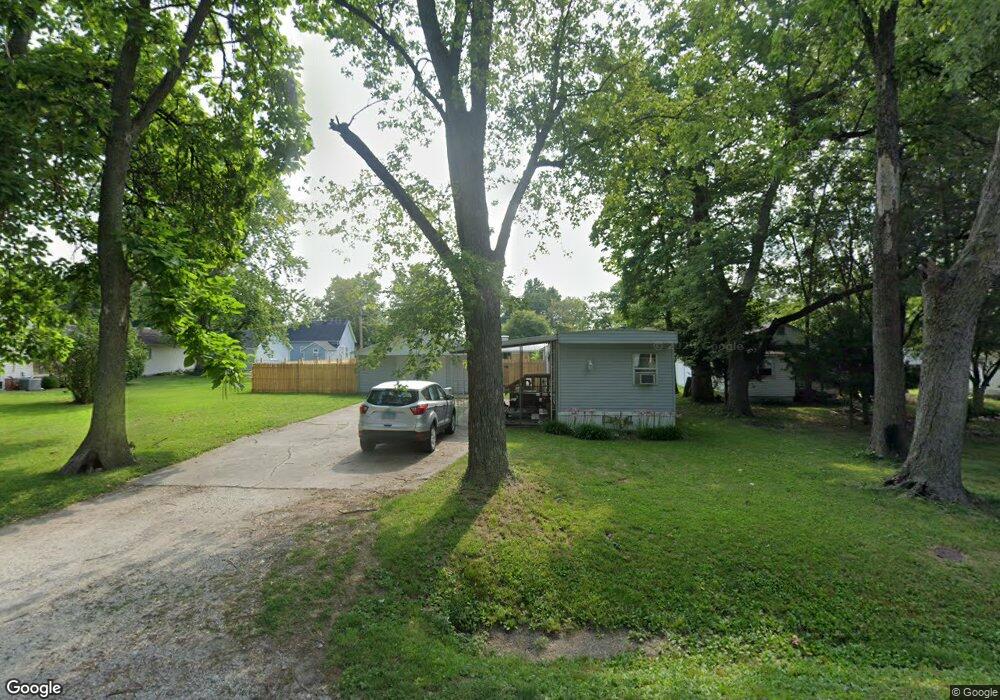
403 S 4th St Altamont, IL 62411
Estimated Value: $42,000 - $311,000
2
Beds
1
Bath
360
Sq Ft
$323/Sq Ft
Est. Value
About This Home
This home is located at 403 S 4th St, Altamont, IL 62411 and is currently estimated at $116,204, approximately $322 per square foot. 403 S 4th St is a home located in Effingham County with nearby schools including Altamont Grade School, Altamont High School, and Altamont Lutheran Interparish School.
Ownership History
Date
Name
Owned For
Owner Type
Purchase Details
Closed on
Jul 8, 2022
Sold by
Ahoy Matey Llc
Bought by
Mcfarland Jason M and Mcfarland Sara C
Current Estimated Value
Home Financials for this Owner
Home Financials are based on the most recent Mortgage that was taken out on this home.
Original Mortgage
$25,000
Outstanding Balance
$23,676
Interest Rate
4.75%
Mortgage Type
Credit Line Revolving
Estimated Equity
$92,528
Purchase Details
Closed on
Dec 2, 2021
Sold by
Vogel Judith E
Bought by
Ahoy Matey Llc
Home Financials for this Owner
Home Financials are based on the most recent Mortgage that was taken out on this home.
Original Mortgage
$16,000
Interest Rate
3.09%
Mortgage Type
Commercial
Purchase Details
Closed on
Dec 3, 2002
Sold by
Erlenbush Donald G and Hamilton Janet
Bought by
Vogel Judith E
Create a Home Valuation Report for This Property
The Home Valuation Report is an in-depth analysis detailing your home's value as well as a comparison with similar homes in the area
Home Values in the Area
Average Home Value in this Area
Purchase History
| Date | Buyer | Sale Price | Title Company |
|---|---|---|---|
| Mcfarland Jason M | -- | Pavlik Sarah Delano | |
| Mcfarland Jason M | -- | None Listed On Document | |
| Ahoy Matey Llc | $20,000 | Richard J Day Pc | |
| Vogel Judith E | $12,500 | None Available | |
| Vogel Judith E | $12,500 | -- |
Source: Public Records
Mortgage History
| Date | Status | Borrower | Loan Amount |
|---|---|---|---|
| Open | Mcfarland Jason M | $25,000 | |
| Closed | Mcfarland Jason M | $25,000 | |
| Previous Owner | Ahoy Matey Llc | $16,000 |
Source: Public Records
Tax History Compared to Growth
Tax History
| Year | Tax Paid | Tax Assessment Tax Assessment Total Assessment is a certain percentage of the fair market value that is determined by local assessors to be the total taxable value of land and additions on the property. | Land | Improvement |
|---|---|---|---|---|
| 2024 | $468 | $12,830 | $4,310 | $8,520 |
| 2023 | $438 | $6,290 | $3,950 | $2,340 |
| 2022 | $408 | $5,670 | $3,560 | $2,110 |
| 2021 | $0 | $5,670 | $3,560 | $2,110 |
| 2020 | $0 | $5,640 | $3,540 | $2,100 |
| 2019 | $0 | $5,420 | $3,400 | $2,020 |
| 2018 | $0 | $5,210 | $3,270 | $1,940 |
| 2017 | $0 | $5,030 | $3,160 | $1,870 |
| 2016 | $353 | $4,930 | $3,100 | $1,830 |
| 2015 | -- | $4,650 | $2,920 | $1,730 |
| 2014 | -- | $4,560 | $2,860 | $1,700 |
| 2013 | -- | $4,560 | $2,860 | $1,700 |
| 2012 | -- | $4,560 | $2,860 | $1,700 |
Source: Public Records
Map
Nearby Homes
- 401 S 3rd St
- 107 S Edwards St
- 805 W Madison Ave
- 8 W John Adams Ave
- 711 E Division St
- 505 N St Clair St
- 707 Meadows St
- 710 Field St
- 2872 E Empire Dr
- 11692 N 100th St
- 7737 County Road 500 E
- 5884 E 950th Ave
- 5504 N 1st St
- 916 N Maple St
- 14374 N 1st St
- 1012 N Main St
- 804 N Main St
- 905 N Olive St
- 216 W 4th St
- 315 W 7th St