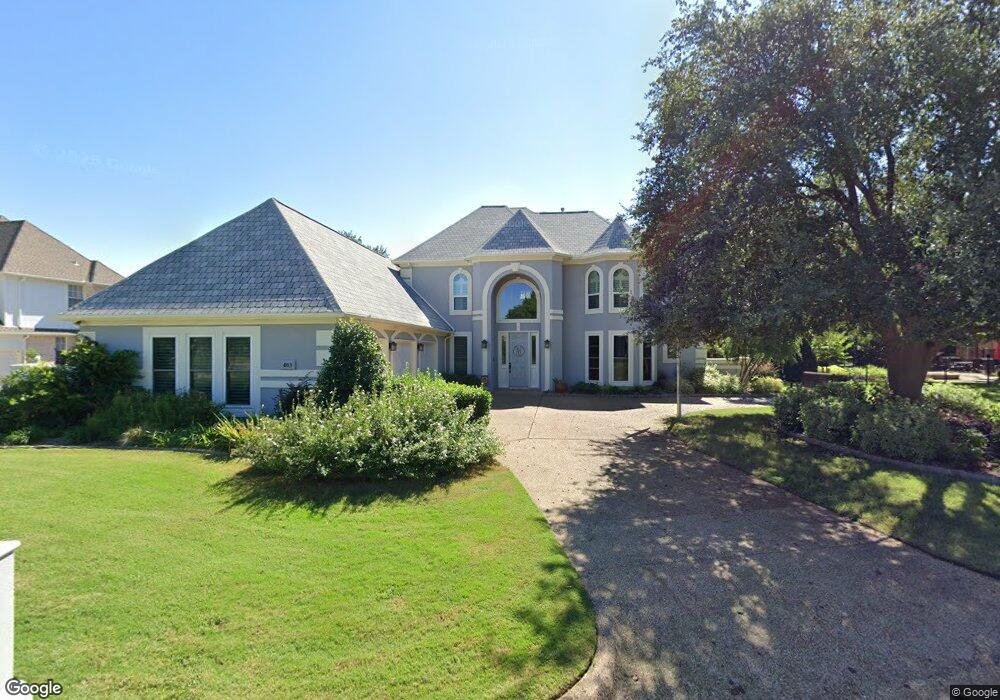
403 Southridge Lakes Pkwy Southlake, TX 76092
Estimated Value: $1,116,000 - $1,217,000
4
Beds
3
Baths
3,572
Sq Ft
$321/Sq Ft
Est. Value
About This Home
This home is located at 403 Southridge Lakes Pkwy, Southlake, TX 76092 and is currently estimated at $1,147,558, approximately $321 per square foot. 403 Southridge Lakes Pkwy is a home located in Tarrant County with nearby schools including Don T. Durham Intermediate School, Walnut Grove Elementary School, and Carroll Middle School.
Ownership History
Date
Name
Owned For
Owner Type
Purchase Details
Closed on
Jul 17, 2023
Sold by
Vickers Laura
Bought by
Laura Vickers Family Trust and Vickers
Current Estimated Value
Purchase Details
Closed on
Jun 24, 2023
Sold by
Vickers James
Bought by
Vickers Laura
Purchase Details
Closed on
Apr 3, 1995
Sold by
Barfield Building Company
Bought by
Vickers James and Vickers Laura
Home Financials for this Owner
Home Financials are based on the most recent Mortgage that was taken out on this home.
Original Mortgage
$218,000
Interest Rate
6.75%
Purchase Details
Closed on
Jun 9, 1994
Sold by
Arvida/Jmb Partners Lp Ii
Bought by
Barfield Building Company
Home Financials for this Owner
Home Financials are based on the most recent Mortgage that was taken out on this home.
Original Mortgage
$235,000
Interest Rate
8.23%
Mortgage Type
Construction
Create a Home Valuation Report for This Property
The Home Valuation Report is an in-depth analysis detailing your home's value as well as a comparison with similar homes in the area
Home Values in the Area
Average Home Value in this Area
Purchase History
| Date | Buyer | Sale Price | Title Company |
|---|---|---|---|
| Laura Vickers Family Trust | -- | None Listed On Document | |
| Vickers Laura | -- | None Listed On Document | |
| Vickers James | -- | Stewart Title | |
| Barfield Building Company | -- | American Title Company |
Source: Public Records
Mortgage History
| Date | Status | Borrower | Loan Amount |
|---|---|---|---|
| Previous Owner | Vickers James | $218,000 | |
| Previous Owner | Barfield Building Company | $235,000 |
Source: Public Records
Tax History Compared to Growth
Tax History
| Year | Tax Paid | Tax Assessment Tax Assessment Total Assessment is a certain percentage of the fair market value that is determined by local assessors to be the total taxable value of land and additions on the property. | Land | Improvement |
|---|---|---|---|---|
| 2025 | $8,768 | $1,068,833 | $401,760 | $667,073 |
| 2024 | $8,768 | $1,068,833 | $401,760 | $667,073 |
| 2023 | $15,475 | $1,073,924 | $401,760 | $672,164 |
| 2022 | $16,652 | $839,888 | $272,300 | $567,588 |
| 2021 | $15,998 | $701,678 | $272,300 | $429,378 |
| 2020 | $15,240 | $663,004 | $265,140 | $397,864 |
| 2019 | $15,013 | $620,000 | $202,500 | $417,500 |
| 2018 | $11,981 | $620,000 | $175,500 | $444,500 |
| 2017 | $14,372 | $632,828 | $148,500 | $484,328 |
| 2016 | $13,065 | $559,790 | $148,500 | $411,290 |
| 2015 | $11,565 | $479,200 | $94,500 | $384,700 |
| 2014 | $11,565 | $479,200 | $94,500 | $384,700 |
Source: Public Records
Map
Nearby Homes
- 403 Presidio Ct
- 204 Southridge Lakes Pkwy
- 810 Brazos Dr
- 550 N Peytonville Ave
- 203 Donley Ct
- 203 Manor Place
- 207 Killdeer Trail
- 305 Sheffield Dr
- 300 Shady Oaks Dr
- 1340 Meadow Glen
- 2530 & 2580 W Southlake Blvd
- 912 Berkshire Rd
- 102 Springbrook Ct
- 1712 Wild Rose Way
- 1371 Holland Hill
- 914 Turnberry Ln
- 1811 Redwing Ct
- 806 Ridgedale Ct
- 2116 Camden Cir
- 806 Shadow Glen Dr
- 401 Southridge Lakes Pkwy
- 1115 Crockett Ct
- 402 Bosque Cir
- 1113 Crockett Ct
- 311 Southridge Lakes Pkwy
- 400 Bosque Cir
- 402 Southridge Lakes Pkwy
- 404 Bosque Cir
- 400 Southridge Lakes Pkwy
- 1111 Crockett Ct
- 405 Southridge Lakes Pkwy
- 404 Southridge Lakes Pkwy
- 312 Southridge Lakes Pkwy
- 309 Southridge Lakes Pkwy
- 1212 Brazos Dr
- 1109 Crockett Ct
- 1210 Brazos Dr
- 310 Southridge Lakes Pkwy
- 403 Bosque Cir
- 401 Bosque Cir