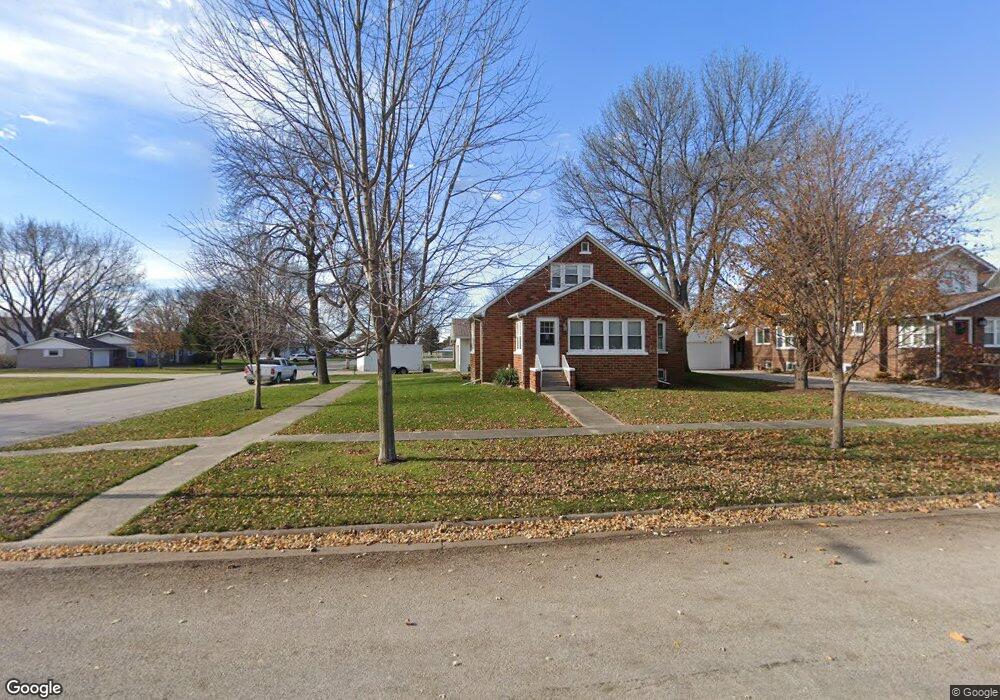
403 Spruce St Allison, IA 50602
Estimated Value: $131,000 - $141,000
3
Beds
1
Bath
1,221
Sq Ft
$112/Sq Ft
Est. Value
About This Home
This home is located at 403 Spruce St, Allison, IA 50602 and is currently estimated at $137,184, approximately $112 per square foot. 403 Spruce St is a home located in Butler County with nearby schools including North Butler Elementary and North Butler Junior/Senior High School.
Ownership History
Date
Name
Owned For
Owner Type
Purchase Details
Closed on
Dec 2, 2009
Sold by
Kluiter Nathan D and Kluiter Nicole A
Bought by
Buss Derek R
Current Estimated Value
Home Financials for this Owner
Home Financials are based on the most recent Mortgage that was taken out on this home.
Original Mortgage
$74,460
Outstanding Balance
$48,274
Interest Rate
5.02%
Mortgage Type
New Conventional
Estimated Equity
$88,910
Purchase Details
Closed on
Nov 14, 2005
Sold by
Kluiter Nathan D and Kluiter Nicole A
Bought by
Kluiter Nathan D and Kluiter Nicole A
Create a Home Valuation Report for This Property
The Home Valuation Report is an in-depth analysis detailing your home's value as well as a comparison with similar homes in the area
Purchase History
| Date | Buyer | Sale Price | Title Company |
|---|---|---|---|
| Buss Derek R | $73,000 | None Available | |
| Kluiter Nathan D | -- | None Available |
Source: Public Records
Mortgage History
| Date | Status | Borrower | Loan Amount |
|---|---|---|---|
| Open | Buss Derek R | $74,460 |
Source: Public Records
Tax History
| Year | Tax Paid | Tax Assessment Tax Assessment Total Assessment is a certain percentage of the fair market value that is determined by local assessors to be the total taxable value of land and additions on the property. | Land | Improvement |
|---|---|---|---|---|
| 2025 | $1,810 | $113,680 | $9,550 | $104,130 |
| 2024 | $1,810 | $114,180 | $9,550 | $104,630 |
| 2023 | $1,664 | $114,180 | $9,550 | $104,630 |
| 2022 | $1,580 | $94,680 | $9,550 | $85,130 |
| 2021 | $1,558 | $94,680 | $9,550 | $85,130 |
| 2020 | $1,558 | $85,950 | $9,550 | $76,400 |
| 2019 | $1,450 | $80,480 | $0 | $0 |
| 2018 | $1,542 | $80,480 | $0 | $0 |
| 2017 | $1,542 | $80,480 | $0 | $0 |
| 2016 | $1,656 | $83,200 | $0 | $0 |
| 2015 | $1,656 | $83,200 | $0 | $0 |
| 2014 | $1,638 | $83,200 | $0 | $0 |
Source: Public Records
Map
Nearby Homes