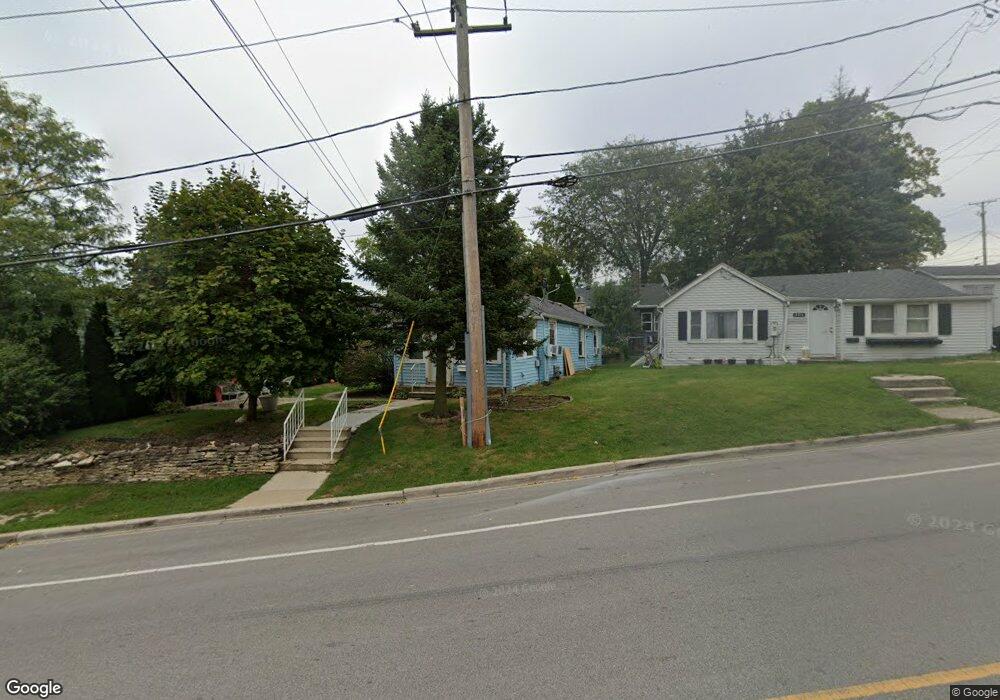
403 Stephen St Lemont, IL 60439
Northeast Lemont NeighborhoodEstimated Value: $196,000 - $241,000
2
Beds
1
Bath
510
Sq Ft
$431/Sq Ft
Est. Value
About This Home
This home is located at 403 Stephen St, Lemont, IL 60439 and is currently estimated at $219,956, approximately $431 per square foot. 403 Stephen St is a home located in Cook County with nearby schools including Oakwood School, River Valley School, and Old Quarry Middle School.
Ownership History
Date
Name
Owned For
Owner Type
Purchase Details
Closed on
Nov 1, 2002
Sold by
Wojciechowski Bernard L and Wojciechowski John J
Bought by
Marquez Antonio and Marquez Narcisa
Current Estimated Value
Home Financials for this Owner
Home Financials are based on the most recent Mortgage that was taken out on this home.
Original Mortgage
$70,000
Outstanding Balance
$29,557
Interest Rate
6.13%
Estimated Equity
$190,399
Create a Home Valuation Report for This Property
The Home Valuation Report is an in-depth analysis detailing your home's value as well as a comparison with similar homes in the area
Home Values in the Area
Average Home Value in this Area
Purchase History
| Date | Buyer | Sale Price | Title Company |
|---|---|---|---|
| Marquez Antonio | -- | First American Title |
Source: Public Records
Mortgage History
| Date | Status | Borrower | Loan Amount |
|---|---|---|---|
| Open | Marquez Antonio | $70,000 |
Source: Public Records
Tax History Compared to Growth
Tax History
| Year | Tax Paid | Tax Assessment Tax Assessment Total Assessment is a certain percentage of the fair market value that is determined by local assessors to be the total taxable value of land and additions on the property. | Land | Improvement |
|---|---|---|---|---|
| 2024 | $2,844 | $17,000 | $2,854 | $14,146 |
| 2023 | $1,664 | $17,000 | $2,854 | $14,146 |
| 2022 | $1,664 | $10,275 | $2,512 | $7,763 |
| 2021 | $1,634 | $10,274 | $2,511 | $7,763 |
| 2020 | $1,706 | $10,274 | $2,511 | $7,763 |
| 2019 | $1,429 | $9,607 | $2,511 | $7,096 |
| 2018 | $1,404 | $9,607 | $2,511 | $7,096 |
| 2017 | $1,397 | $9,607 | $2,511 | $7,096 |
| 2016 | $1,144 | $7,344 | $2,055 | $5,289 |
| 2015 | $1,131 | $7,344 | $2,055 | $5,289 |
| 2014 | $1,155 | $7,344 | $2,055 | $5,289 |
| 2013 | $943 | $6,777 | $2,055 | $4,722 |
Source: Public Records
Map
Nearby Homes