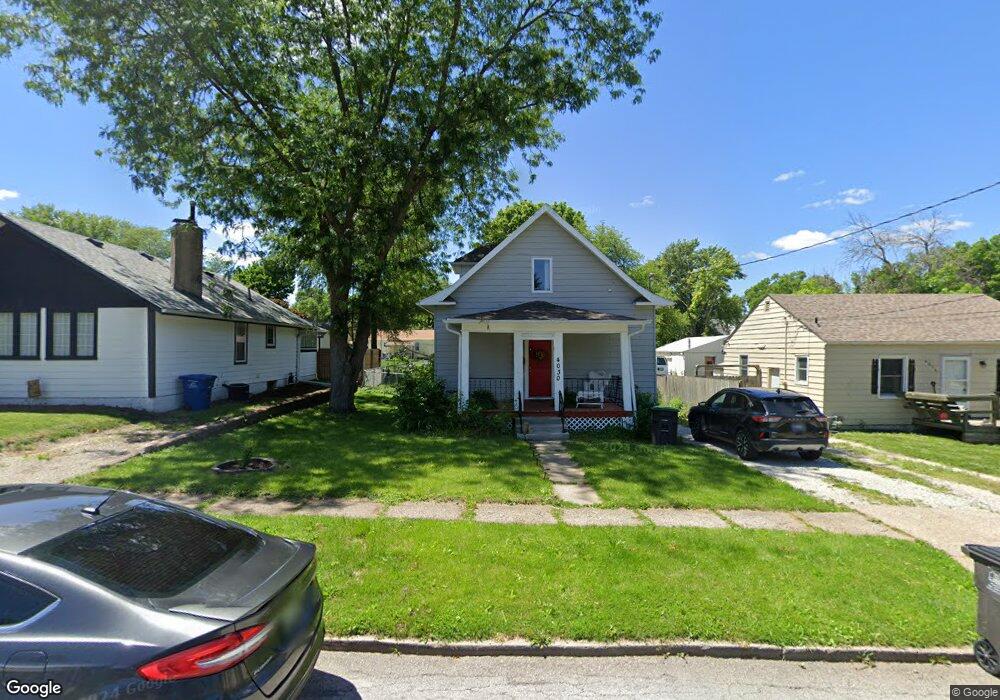
4030 8th Place Des Moines, IA 50313
Oak Park NeighborhoodEstimated Value: $124,000 - $161,000
3
Beds
1
Bath
842
Sq Ft
$171/Sq Ft
Est. Value
About This Home
This home is located at 4030 8th Place, Des Moines, IA 50313 and is currently estimated at $144,042, approximately $171 per square foot. 4030 8th Place is a home located in Polk County with nearby schools including Oak Park Elementary School, Harding Middle School, and North High School.
Ownership History
Date
Name
Owned For
Owner Type
Purchase Details
Closed on
Mar 1, 2022
Sold by
Community Improvement Group Inc
Bought by
Cam 2022 Llc
Current Estimated Value
Home Financials for this Owner
Home Financials are based on the most recent Mortgage that was taken out on this home.
Original Mortgage
$92,720
Outstanding Balance
$86,242
Interest Rate
3.69%
Mortgage Type
Construction
Estimated Equity
$57,800
Purchase Details
Closed on
Feb 28, 2022
Sold by
Millard Mary K
Bought by
Community Improvement Group Inc
Home Financials for this Owner
Home Financials are based on the most recent Mortgage that was taken out on this home.
Original Mortgage
$92,720
Outstanding Balance
$86,242
Interest Rate
3.69%
Mortgage Type
Construction
Estimated Equity
$57,800
Purchase Details
Closed on
Jan 18, 2013
Sold by
Millard Mary Kay and Lynch Mary Kay
Bought by
Millard Mary K
Home Financials for this Owner
Home Financials are based on the most recent Mortgage that was taken out on this home.
Original Mortgage
$50,000
Interest Rate
3.34%
Mortgage Type
New Conventional
Create a Home Valuation Report for This Property
The Home Valuation Report is an in-depth analysis detailing your home's value as well as a comparison with similar homes in the area
Home Values in the Area
Average Home Value in this Area
Purchase History
| Date | Buyer | Sale Price | Title Company |
|---|---|---|---|
| Cam 2022 Llc | $75,000 | Hubbard Law Firm Pc | |
| Community Improvement Group Inc | $60,000 | None Listed On Document | |
| Millard Mary K | -- | None Available |
Source: Public Records
Mortgage History
| Date | Status | Borrower | Loan Amount |
|---|---|---|---|
| Open | Cam 2022 Llc | $92,720 | |
| Previous Owner | Millard Mary K | $50,000 |
Source: Public Records
Tax History Compared to Growth
Tax History
| Year | Tax Paid | Tax Assessment Tax Assessment Total Assessment is a certain percentage of the fair market value that is determined by local assessors to be the total taxable value of land and additions on the property. | Land | Improvement |
|---|---|---|---|---|
| 2025 | $1,620 | $113,700 | $32,500 | $81,200 |
| 2024 | $1,620 | $82,300 | $28,000 | $54,300 |
| 2023 | $1,728 | $98,000 | $28,000 | $70,000 |
| 2022 | $1,504 | $73,300 | $26,300 | $47,000 |
| 2021 | $1,430 | $73,300 | $26,300 | $47,000 |
| 2020 | $1,480 | $65,900 | $24,100 | $41,800 |
| 2019 | $1,302 | $65,900 | $24,100 | $41,800 |
| 2018 | $1,284 | $57,000 | $20,700 | $36,300 |
| 2017 | $1,114 | $57,000 | $20,700 | $36,300 |
| 2016 | $1,080 | $49,700 | $18,000 | $31,700 |
| 2015 | $1,080 | $49,700 | $18,000 | $31,700 |
| 2014 | $1,022 | $48,800 | $17,500 | $31,300 |
Source: Public Records
Map
Nearby Homes