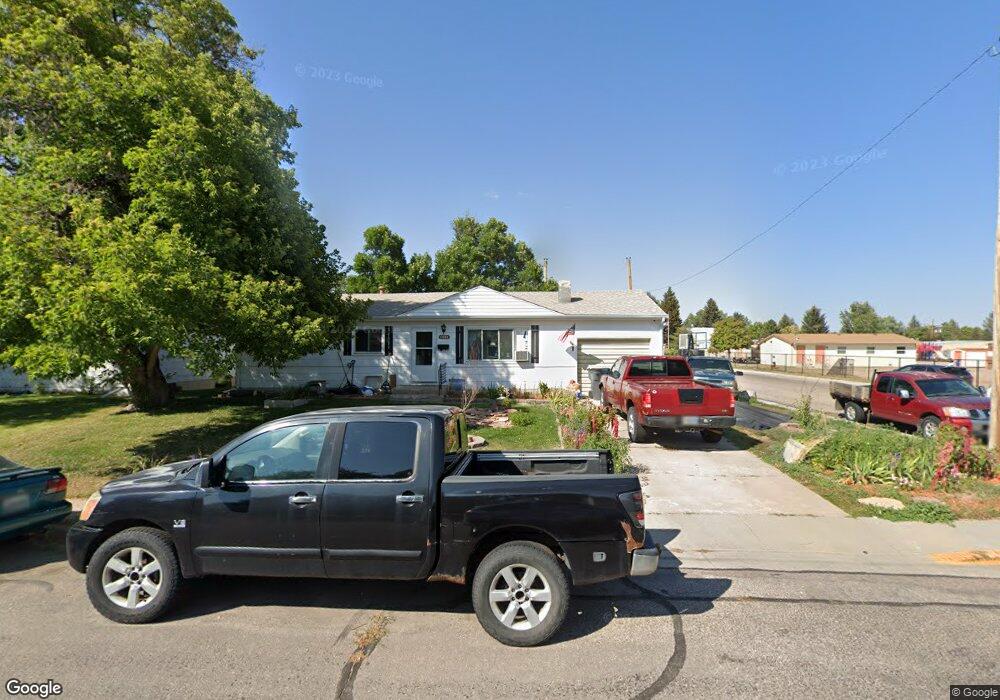
4030 E 8th St Cheyenne, WY 82001
Sun Valley NeighborhoodEstimated Value: $317,000 - $329,000
Studio
--
Bath
1,008
Sq Ft
$320/Sq Ft
Est. Value
About This Home
This home is located at 4030 E 8th St, Cheyenne, WY 82001 and is currently estimated at $322,178, approximately $319 per square foot. 4030 E 8th St is a home located in Laramie County with nearby schools including Bain Elementary School, Johnson Junior High School, and South High School.
Ownership History
Date
Name
Owned For
Owner Type
Purchase Details
Closed on
Oct 16, 2015
Sold by
Harvey Amos S and Harvey Leabeth
Bought by
Harvey Amos S and Harvey Leabeth
Current Estimated Value
Home Financials for this Owner
Home Financials are based on the most recent Mortgage that was taken out on this home.
Original Mortgage
$132,885
Outstanding Balance
$104,726
Interest Rate
4.25%
Mortgage Type
FHA
Estimated Equity
$217,452
Purchase Details
Closed on
Oct 15, 2003
Sold by
Green Sharon L
Bought by
Harvey Leabeth and Harvey Amos S
Home Financials for this Owner
Home Financials are based on the most recent Mortgage that was taken out on this home.
Original Mortgage
$113,223
Interest Rate
6.42%
Mortgage Type
FHA
Purchase Details
Closed on
May 28, 1999
Sold by
Lafollette Lowell L and Lafollette Marian E
Bought by
Green Sharon L
Home Financials for this Owner
Home Financials are based on the most recent Mortgage that was taken out on this home.
Original Mortgage
$71,900
Interest Rate
6.89%
Create a Home Valuation Report for This Property
The Home Valuation Report is an in-depth analysis detailing your home's value as well as a comparison with similar homes in the area
Home Values in the Area
Average Home Value in this Area
Purchase History
| Date | Buyer | Sale Price | Title Company |
|---|---|---|---|
| Harvey Amos S | -- | None Available | |
| Harvey Leabeth | -- | -- | |
| Green Sharon L | -- | Laramie Cnty Abstract & Titl |
Source: Public Records
Mortgage History
| Date | Status | Borrower | Loan Amount |
|---|---|---|---|
| Open | Harvey Amos S | $132,885 | |
| Closed | Harvey Leabeth | $113,223 | |
| Previous Owner | Green Sharon L | $71,900 |
Source: Public Records
Tax History
| Year | Tax Paid | Tax Assessment Tax Assessment Total Assessment is a certain percentage of the fair market value that is determined by local assessors to be the total taxable value of land and additions on the property. | Land | Improvement |
|---|---|---|---|---|
| 2025 | $1,732 | $18,993 | $3,075 | $15,918 |
| 2024 | $1,732 | $24,493 | $4,100 | $20,393 |
| 2023 | $1,729 | $24,450 | $4,100 | $20,350 |
| 2022 | $1,659 | $22,989 | $4,100 | $18,889 |
| 2021 | $1,435 | $19,834 | $4,100 | $15,734 |
| 2020 | $1,324 | $18,360 | $4,100 | $14,260 |
| 2019 | $1,227 | $16,992 | $4,100 | $12,892 |
| 2018 | $1,121 | $15,679 | $3,592 | $12,087 |
| 2017 | $1,070 | $14,826 | $2,889 | $11,937 |
| 2016 | $1,018 | $14,105 | $2,845 | $11,260 |
| 2015 | $936 | $12,960 | $2,845 | $10,115 |
| 2014 | $937 | $12,886 | $2,845 | $10,041 |
Source: Public Records
Map
Nearby Homes
- 4022 E 7th St
- Lot 2 E 13th St
- 810 Cahill Dr
- 4404 Cottage Ln
- 4400 E 13th St
- 4705 Raleigh Dr
- 956 Hillcrest Rd
- 4920 E 6th St
- Lot 10 Raleigh Dr
- Lot 11 Raleigh Dr
- Lot 12 Raleigh Dr
- 3331 Belaire Ave
- 821 Stevens Dr
- TBD Taft Ave
- 840 Stevens Dr
- TBD Livingston Ave
- 5250 Atlantic Dr
- 5241 Atlantic Dr
- 7723 Three Hearts Trail
- 1532 Copperville Rd
Your Personal Tour Guide
Ask me questions while you tour the home.