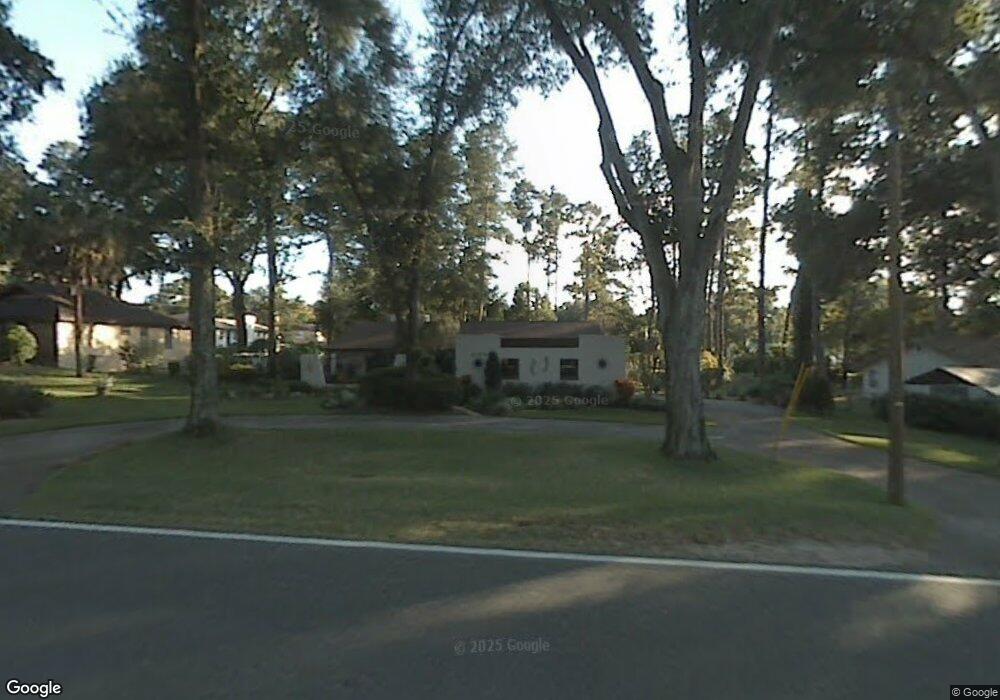
4030 NE 7 St Ocala, FL 34470
Northeast Ocala NeighborhoodEstimated Value: $259,000 - $305,000
3
Beds
2
Baths
1,701
Sq Ft
$167/Sq Ft
Est. Value
About This Home
This home is located at 4030 NE 7 St, Ocala, FL 34470 and is currently estimated at $283,928, approximately $166 per square foot. 4030 NE 7 St is a home located in Marion County with nearby schools including Ward-Highlands Elementary School, Fort King Middle School, and Vanguard High School.
Ownership History
Date
Name
Owned For
Owner Type
Purchase Details
Closed on
Apr 21, 2021
Sold by
Par Due Chad J and Par Due Ashley
Bought by
Troisi Joelle F
Current Estimated Value
Home Financials for this Owner
Home Financials are based on the most recent Mortgage that was taken out on this home.
Original Mortgage
$187,000
Outstanding Balance
$168,974
Interest Rate
3.05%
Mortgage Type
New Conventional
Estimated Equity
$114,955
Purchase Details
Closed on
Feb 1, 2012
Sold by
Dodge N P
Bought by
Par Due Chad J and Par Due Ashley E
Home Financials for this Owner
Home Financials are based on the most recent Mortgage that was taken out on this home.
Original Mortgage
$107,211
Interest Rate
3.97%
Mortgage Type
FHA
Purchase Details
Closed on
Jun 15, 2001
Sold by
Kolberg John and Kolberg Marlene
Bought by
Mcguffey Kindt Jacqueline M and Kindt Alex G
Home Financials for this Owner
Home Financials are based on the most recent Mortgage that was taken out on this home.
Original Mortgage
$98,719
Interest Rate
7.06%
Create a Home Valuation Report for This Property
The Home Valuation Report is an in-depth analysis detailing your home's value as well as a comparison with similar homes in the area
Home Values in the Area
Average Home Value in this Area
Purchase History
| Date | Buyer | Sale Price | Title Company |
|---|---|---|---|
| Troisi Joelle F | $220,000 | First American Title Ins Co | |
| Par Due Chad J | $110,000 | Attorney | |
| Dodge N P | $122,000 | Attorney | |
| Mcguffey Kindt Jacqueline M | $99,500 | Title Offices Llc |
Source: Public Records
Mortgage History
| Date | Status | Borrower | Loan Amount |
|---|---|---|---|
| Open | Troisi Joelle F | $187,000 | |
| Previous Owner | Par Due Chad J | $107,211 | |
| Previous Owner | Mcguffey Kindt Jacqueline M | $98,719 |
Source: Public Records
Tax History Compared to Growth
Tax History
| Year | Tax Paid | Tax Assessment Tax Assessment Total Assessment is a certain percentage of the fair market value that is determined by local assessors to be the total taxable value of land and additions on the property. | Land | Improvement |
|---|---|---|---|---|
| 2024 | $4,532 | $233,196 | -- | -- |
| 2023 | $4,532 | $211,996 | $0 | $0 |
| 2022 | $3,596 | $192,724 | $36,421 | $156,303 |
| 2021 | $3,169 | $152,759 | $31,218 | $121,541 |
| 2020 | $2,602 | $142,295 | $20,812 | $121,483 |
| 2019 | $2,567 | $139,020 | $20,812 | $118,208 |
| 2018 | $2,435 | $133,966 | $20,812 | $113,154 |
| 2017 | $2,284 | $123,653 | $13,008 | $110,645 |
| 2016 | $2,237 | $119,635 | $0 | $0 |
| 2015 | $2,133 | $112,286 | $0 | $0 |
| 2014 | $1,860 | $105,190 | $0 | $0 |
Source: Public Records
Map
Nearby Homes
- 802 NE 39th Ct
- 1031 NE 39th Ct
- 3930 NE 11th St
- 3814 NE 5th St
- 4516 NE 8th St
- 247 NE 44th Ave
- 4609 NE 7th St
- 545 NE 45th Ct
- TBA SW 19th Terrace
- 4626 NE 7th St
- 4418 NE 4th St
- 0 Tbd Ne 36 Ave
- 0 Silver Springs Shores Uniit 35 Blk 968 Lot 2 Unit MFRTB8342712
- 126 SE 41st Ave
- 4701 NE 9th St
- 148 SE 39th Terrace
- 3446 NE 11th St
- 4145 SE 3rd St
- 4801 NE 8th St
- 3525 E Fort King St Unit 140
- 4030 NE 7th St
- 4020 NE 7th St
- 4040 NE 7th St
- 4023 NE 6th Place
- 550 NE 41st Ave
- 4029 NE 6th Place
- 4010 NE 7th St
- 711 NE 41st Ave
- 716 NE 41st Ave
- 540 NE 41st Ave
- 4023 NE 7 St
- 4105 NE 7th St
- 4110 NE 7th St
- 4023 NE 7th St
- 4110 NE 7 St
- 539 NE 40th Terrace
- 0 NE 7th St Unit R4706371
- 0 NE 7th St Unit OM644845
- 0 NE 7th St Unit C7459595
- 0 NE 7th St Unit OM401027